

Sediment bacterial communities reflect the history of a sea basin
- PMID: 23372707
- PMCID: PMC3553170
- DOI: 10.1371/journal.pone.0054326
Sediment bacterial communities reflect the history of a sea basin
Abstract
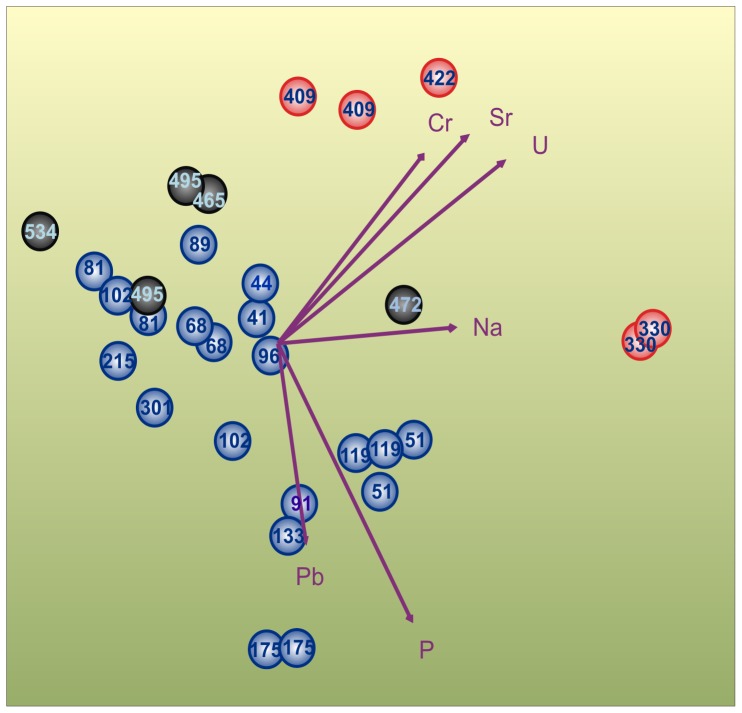
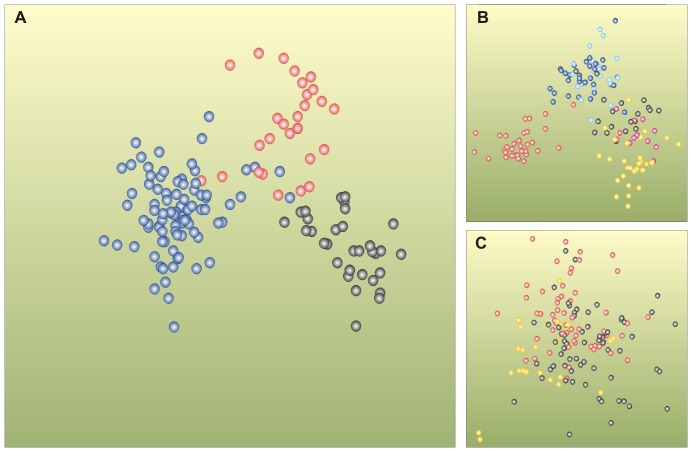
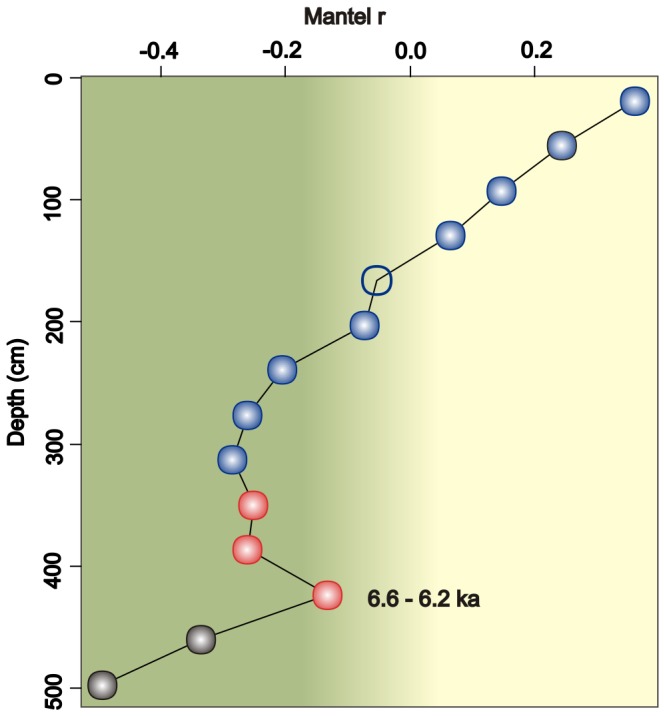
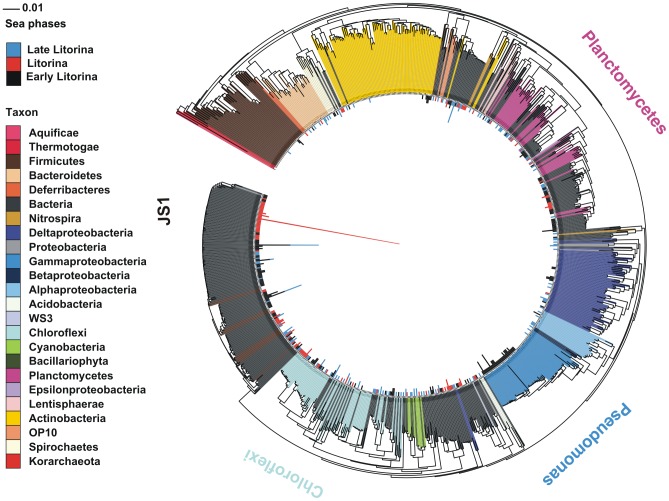
How entire microbial communities are structured across stratified sediments from the historical standpoint is unknown. The Baltic Sea is an ideal research object for historical reconstruction, since it has experienced many fresh- and brackish water periods and is depleted of dissolved oxygen, which increases the sediment's preservation potential. We investigated the bacterial communities, chemical elements (e.g. Cr, Pb Na, P, Sr and U) and sediment composition in a stratified sediment core dated by radiocarbon and spanning 8000 years of Baltic Sea history, using up-to-date multivariate statistics. The communities were analysed by 16S rRNA gene terminal restriction fragment length polymorphism. The communities of the deep Early Litorina and surface Late Litorina Sea laminae were separated from the communities of the middle Litorina Sea laminae, which were associated with elevated concentrations of U and Sr trace elements, palaeo-oxygen and palaeosalinity proxies. Thus, the Litorina Sea laminae were characterized by past oxygen deficiency and salinity increase. The communities of the laminae, bioturbated and homogeneous sediments were differentiated, based on the same historical sea phases, with correct classifications of 90%. Palaeosalinity was one of the major parameters that separated the bacterial communities of the stratified sediments. A discontinuous spatial structure with a surprising increase in community heterogeneity was detected in Litorina Sea sediments from 388 to 422 cm deep, which suggests that a salinity maximum occurred in the central Gulf of Finland app. 6200-6600 years ago. The community heterogeneity decreased from the surface down to 306 cm, which reflected downcore mineralization. The plateau of the decrease was in the app. 2000-year-old sediment layers. Bacterial community data may be used as an additional tool in ocean-drilling projects, in which it is important to detect mineralization plateaus both to determine historically comparable portions of sediment samples and historical events, such as sea-level rise culminations.
Conflict of interest statement
Figures
Similar articles
-
Bacteria contribute to sediment nutrient release and reflect progressed eutrophication-driven hypoxia in an organic-rich continental sea.PLoS One. 2013 Jun 25;8(6):e67061. doi: 10.1371/journal.pone.0067061. Print 2013. PLoS One. 2013. PMID: 23825619 Free PMC article.
-
Shifts in coastal sediment oxygenation cause pronounced changes in microbial community composition and associated metabolism.Microbiome. 2017 Aug 9;5(1):96. doi: 10.1186/s40168-017-0311-5. Microbiome. 2017. PMID: 28793929 Free PMC article.
-
Archaeal and bacterial communities respond differently to environmental gradients in anoxic sediments of a California hypersaline lake, the Salton Sea.Appl Environ Microbiol. 2010 Feb;76(3):757-68. doi: 10.1128/AEM.02409-09. Epub 2009 Nov 30. Appl Environ Microbiol. 2010. PMID: 19948847 Free PMC article.
-
Exploring Deep-Sea Brines as Potential Terrestrial Analogues of Oceans in the Icy Moons of the Outer Solar System.Curr Issues Mol Biol. 2020;38:123-162. doi: 10.21775/cimb.038.123. Epub 2020 Jan 22. Curr Issues Mol Biol. 2020. PMID: 31967579 Review.
-
Spatial and temporal oxygen dynamics in macrofaunal burrows in sediments: a review of analytical tools and observational evidence.Microbes Environ. 2013;28(2):166-79. doi: 10.1264/jsme2.me12182. Epub 2013 Apr 16. Microbes Environ. 2013. PMID: 23594972 Free PMC article. Review.
Cited by
-
Microbial Organic Matter Degradation Potential in Baltic Sea Sediments Is Influenced by Depositional Conditions and In Situ Geochemistry.Appl Environ Microbiol. 2019 Feb 6;85(4):e02164-18. doi: 10.1128/AEM.02164-18. Print 2019 Feb 15. Appl Environ Microbiol. 2019. PMID: 30504213 Free PMC article.
-
Climate oscillations reflected within the microbiome of Arabian Sea sediments.Sci Rep. 2017 Jul 20;7(1):6040. doi: 10.1038/s41598-017-05590-9. Sci Rep. 2017. PMID: 28729646 Free PMC article.
-
Metagenomic insights into surface water microbial communities of a South Asian mangrove ecosystem.PeerJ. 2022 May 9;10:e13169. doi: 10.7717/peerj.13169. eCollection 2022. PeerJ. 2022. PMID: 35573175 Free PMC article.
-
Redox-specialized bacterioplankton metacommunity in a temperate estuary.PLoS One. 2015 Apr 10;10(4):e0122304. doi: 10.1371/journal.pone.0122304. eCollection 2015. PLoS One. 2015. PMID: 25860812 Free PMC article.
-
Bacteria contribute to sediment nutrient release and reflect progressed eutrophication-driven hypoxia in an organic-rich continental sea.PLoS One. 2013 Jun 25;8(6):e67061. doi: 10.1371/journal.pone.0067061. Print 2013. PLoS One. 2013. PMID: 23825619 Free PMC article.
References
-
- Berglund BE, Sandgren P, Barnekow L, Hannon G, Jiang H, et al. (2005) Early Holocene history of the Baltic Sea, as reflected in coastal sediments in Blekinge, southeastern Sweden. Quat Int 130: 111–139.
-
- Zillen L, Conley DJ, Andrén T, Andrén E, Björck S (2008) Past occurrences of hypoxia in the Baltic Sea and the role of climate variability, environmental change and human impact. Earth Sci Rev 91: 77–92.
-
- Andrén E, Andrén T, Kunzendorf H (2000) Holocene history of the Baltic Sea as a background for assessing records of human impact in the sediments of the Gotland basin. Holocene 10: 687–702.
Publication types
MeSH terms
Substances
LinkOut - more resources
Full Text Sources
Other Literature Sources
Research Materials
Miscellaneous
