

Proteomic biomarkers associated with Streptococcus agalactiae invasive genogroups
- PMID: 23372719
- PMCID: PMC3553121
- DOI: 10.1371/journal.pone.0054393
Proteomic biomarkers associated with Streptococcus agalactiae invasive genogroups
Abstract
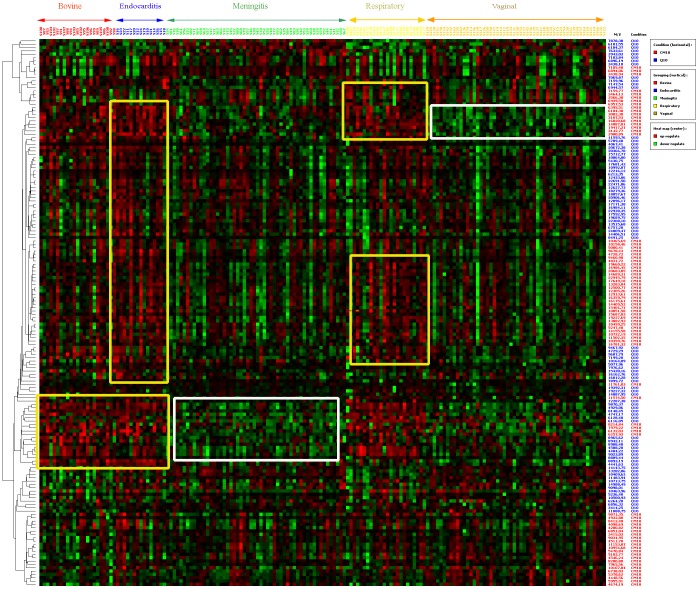
Group B streptococcus (GBS, Streptococcus agalactiae) is a leading cause of meningitis and sepsis in newborns and an etiological agent of meningitis, endocarditis, osteoarticular and soft tissue infections in adults. GBS isolates are routinely clustered in serotypes and in genotypes. At present one GBS sequence type (i.e. ST17) is considered to be closely associated with bacterial invasiveness and novel proteomic biomarkers could make a valuable contribution to currently available GBS typing data. For that purpose we analyzed the protein profiles of 170 genotyped GBS isolates by Surface-Enhanced Laser Desorption/Ionization Time-of-Flight Mass Spectrometry (SELDI). Univariate statistical analysis of the SELDI profiles identified four protein biomarkers significantly discriminating ST17 isolates from those of the other sequence types. Two of these biomarkers (MW of 7878 Da and 12200 Da) were overexpressed and the other two (MW of 6258 Da and 10463 Da) were underexpressed in ST17. The four proteins were isolated by mass spectrometry-assisted purification and their tryptic peptides analyzed by LC-MS/MS. They were thereby identified as the small subunit of exodeoxyribonuclease VII, the 50S ribosomal protein L7/L12, a CsbD-like protein and thioredoxin, respectively. In conclusion, we identified four candidate biomarkers of ST17 by SELDI for high-throughput screening. These markers may serve as a basis for further studies on the pathophysiology of GBS infection, and for the development of novel vaccines.
Conflict of interest statement
Figures


Similar articles
-
Identification of a proteomic biomarker associated with invasive ST1, serotype VI Group B Streptococcus by MALDI-TOF MS.J Microbiol Immunol Infect. 2019 Feb;52(1):81-89. doi: 10.1016/j.jmii.2017.11.007. Epub 2017 Dec 30. J Microbiol Immunol Infect. 2019. PMID: 29317173
-
A simple, rapid typing method for Streptococcus agalactiae based on ribosomal subunit proteins by MALDI-TOF MS.Sci Rep. 2020 May 29;10(1):8788. doi: 10.1038/s41598-020-65707-5. Sci Rep. 2020. PMID: 32472028 Free PMC article.
-
Candidate proteomic biomarkers for three genogroups of the swine pathogen Streptococcus suis serotype 2.BMC Microbiol. 2015 Apr 4;15:84. doi: 10.1186/s12866-015-0401-0. BMC Microbiol. 2015. PMID: 25886383 Free PMC article.
-
Phenotypic and genetic differences among group B Streptococcus recovered from neonates and pregnant women in Shenzhen, China: 8-year study.BMC Microbiol. 2019 Aug 8;19(1):185. doi: 10.1186/s12866-019-1551-2. BMC Microbiol. 2019. PMID: 31395013 Free PMC article.
-
Reliable Detection of Group B Streptococcus in the Clinical Laboratory.J Clin Microbiol. 2017 Sep;55(9):2590-2598. doi: 10.1128/JCM.00582-17. Epub 2017 Jun 28. J Clin Microbiol. 2017. PMID: 28659318 Free PMC article. Review.
Cited by
-
Identification of ClpB, a molecular chaperone involved in the stress tolerance and virulence of Streptococcus agalactiae.Vet Res. 2024 May 15;55(1):60. doi: 10.1186/s13567-024-01318-6. Vet Res. 2024. PMID: 38750480 Free PMC article.
-
Proteomic Analysis and Virulence Assessment of Granulicatella adiacens Secretome.Front Cell Infect Microbiol. 2019 Apr 24;9:104. doi: 10.3389/fcimb.2019.00104. eCollection 2019. Front Cell Infect Microbiol. 2019. PMID: 31069174 Free PMC article.
-
Rapid classification of group B Streptococcus serotypes based on matrix-assisted laser desorption ionization-time of flight mass spectrometry and machine learning techniques.BMC Bioinformatics. 2019 Dec 24;20(Suppl 19):703. doi: 10.1186/s12859-019-3282-7. BMC Bioinformatics. 2019. PMID: 31870283 Free PMC article.
-
Tartaric acid pathways in Vitis vinifera L. (cv. Ugni blanc): a comparative study of two vintages with contrasted climatic conditions.BMC Plant Biol. 2016 Jun 28;16(1):144. doi: 10.1186/s12870-016-0833-1. BMC Plant Biol. 2016. PMID: 27350040 Free PMC article.
-
Proteomic pattern of breast milk discriminates obese mothers with infants of delayed weight gain from normal-weight mothers with infants of normal weight gain.FEBS Open Bio. 2019 Mar 15;9(4):736-742. doi: 10.1002/2211-5463.12610. eCollection 2019 Apr. FEBS Open Bio. 2019. PMID: 30984547 Free PMC article.
References
-
- Edwards MS, Rench MA, Palazzi DL, Baker CJ (2005) Group B streptococcal colonization and serotype-specific immunity in healthy elderly persons. Clin Infect Dis 40: 352–357. - PubMed
-
- Farley MM (2001) Group B streptococcal disease in nonpregnant adults. Clin Infect Dis 33: 556–561. - PubMed
-
- Schuchat A (2001) Group B streptococcal disease: from trials and tribulations to triumph and trepidation. Clin Infect Dis 33: 751–756. - PubMed
MeSH terms
Substances
LinkOut - more resources
Full Text Sources
Other Literature Sources
