

A novel proteomics-based clinical diagnostics technology identifies heterogeneity in activated signaling pathways in gastric cancers
- PMID: 23372746
- PMCID: PMC3556044
- DOI: 10.1371/journal.pone.0054644
A novel proteomics-based clinical diagnostics technology identifies heterogeneity in activated signaling pathways in gastric cancers
Abstract
Purpose: The aim of this study was to utilize the proteomics-based Collaborative Enzyme Enhanced Reactive (CEER) immunoassay to investigate protein tyrosine phosphorylations as diagnostic markers in gastric cancers (GCs).
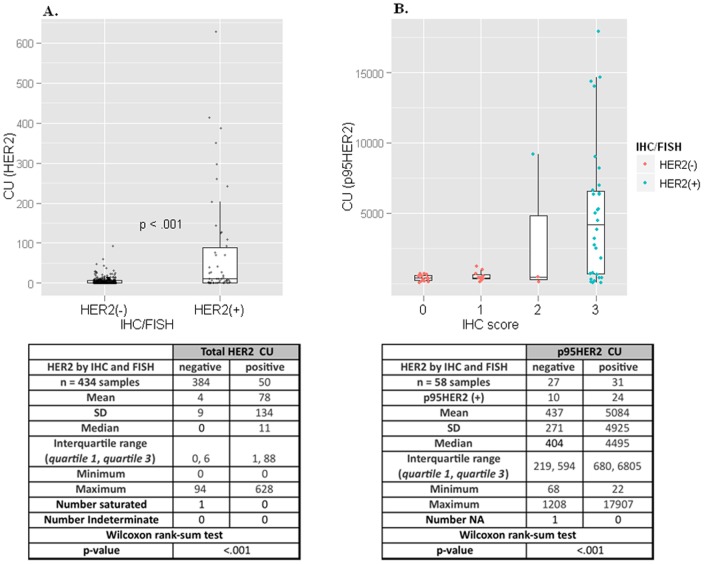
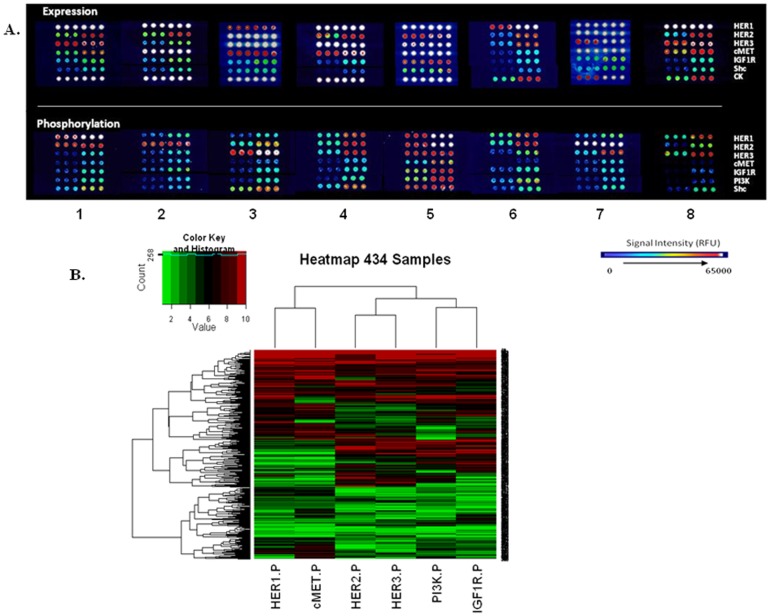
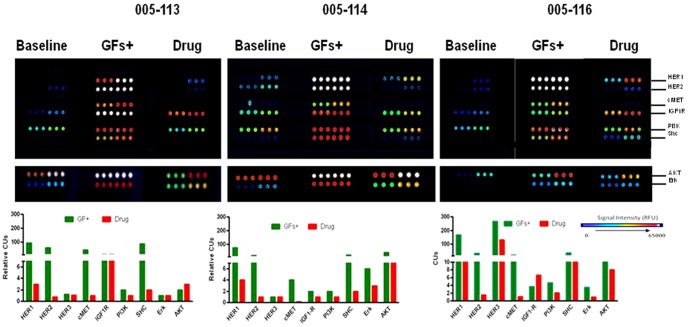
Experimental design: Protein lysates from fresh-frozen 434 advanced stage GCs were analyzed for phosphorylation of HER1, HER2, p95HER2, HER3, cMET, IGF1R and PI3K. The pathway activation patterns were segregated based on the tumor HER2 status. Hierarchical clustering was utilized to determine pathway coactivations in GCs. Prognostic value of pathway activation patterns was determined by correlating disease-free survival times of the various GC subgroups using Kaplan-Meier survival analysis. CEER was also used to determine the presence of tyrosine phosphorylated signaling cascades in circulating tumor cells (CTCs) and ascites tumor cells (ATCs).
Results: Utilizing a novel diagnostics immunoassay, CEER, we demonstrate the presence of p95HER2 and concomitantly activated signaling pathways in GC tumor tissues, CTCs and ATCs isolated from GC patients for the first time. p95HER2 is expressed in ~77% of HER2(+) GCs. Approximately 54% of GCs have an activated HER1, HER2, HER3, cMET or IGF1R and demonstrate a poorer prognosis than those where these receptor tyrosine kinases (RTKs) are not activated. Hierarchical clustering of RTKs reveals co-clustering of phosphorylated HER1:cMET, HER2:HER3 and IGF1R-PI3K. Coactivation of HER1 with cMET renders GCs with a shorter disease-free survival as compared to only cMET activated GCs.
Conclusions: Our study highlights the utility of a novel companion diagnostics technology, CEER that has strong implications for drug development and therapeutic monitoring. CEER is used to provide an increased understanding of activated signaling pathways in advanced GCs that can significantly improve their clinical management through accurate patient selection for targeted therapeutics.
Conflict of interest statement
Figures

Similar articles
-
Activated cMET and IGF1R-driven PI3K signaling predicts poor survival in colorectal cancers independent of KRAS mutational status.PLoS One. 2014 Aug 4;9(8):e103551. doi: 10.1371/journal.pone.0103551. eCollection 2014. PLoS One. 2014. PMID: 25090459 Free PMC article.
-
HER2-positive gastric cancer with concomitant MET and/or EGFR overexpression: a distinct subset of patients for dual inhibition therapy.Int J Cancer. 2015 Apr 1;136(7):1629-35. doi: 10.1002/ijc.29159. Epub 2014 Sep 4. Int J Cancer. 2015. PMID: 25157953
-
Establishment of patient-derived gastric cancer xenografts: a useful tool for preclinical evaluation of targeted therapies involving alterations in HER-2, MET and FGFR2 signaling pathways.BMC Cancer. 2017 Mar 14;17(1):191. doi: 10.1186/s12885-017-3177-9. BMC Cancer. 2017. PMID: 28292264 Free PMC article.
-
cMET as a potential therapeutic target in gastric cancer (Review).Int J Mol Med. 2013 Dec;32(6):1247-54. doi: 10.3892/ijmm.2013.1531. Epub 2013 Oct 18. Int J Mol Med. 2013. PMID: 24141315 Review.
-
How prognostic and predictive biomarkers are transforming our understanding and management of advanced gastric cancer.Oncologist. 2014 Oct;19(10):1046-55. doi: 10.1634/theoncologist.2014-0006. Epub 2014 Aug 20. Oncologist. 2014. PMID: 25142842 Free PMC article. Review.
Cited by
-
MicroRNAs as biomarkers for trastuzumab-based therapy in HER2-positive advanced oesophago-gastric cancer patients.Front Oncol. 2023 Nov 29;13:1258365. doi: 10.3389/fonc.2023.1258365. eCollection 2023. Front Oncol. 2023. PMID: 38094609 Free PMC article.
-
Correlation analysis of mesenchymal-epithelial transition factor protein and human epidermal growth receptor 2 protein expression in 1479 cases of lung adenocarcinoma in China.Thorac Cancer. 2018 Apr;9(4):439-444. doi: 10.1111/1759-7714.12595. Epub 2018 Feb 4. Thorac Cancer. 2018. PMID: 29400000 Free PMC article.
-
Molecular effects of Lapatinib in the treatment of HER2 overexpressing oesophago-gastric adenocarcinoma.Br J Cancer. 2015 Nov 3;113(9):1305-12. doi: 10.1038/bjc.2015.342. Epub 2015 Oct 20. Br J Cancer. 2015. PMID: 26484410 Free PMC article. Clinical Trial.
-
Targeted Therapies and Developing Precision Medicine in Gastric Cancer.Cancers (Basel). 2023 Jun 19;15(12):3248. doi: 10.3390/cancers15123248. Cancers (Basel). 2023. PMID: 37370858 Free PMC article. Review.
-
HER2 Inhibition in Gastric Cancer-Novel Therapeutic Approaches for an Established Target.Cancers (Basel). 2022 Aug 6;14(15):3824. doi: 10.3390/cancers14153824. Cancers (Basel). 2022. PMID: 35954487 Free PMC article. Review.
References
-
- Blume-Jensen P, Hunter T (2001) Oncogenic kinase signalling. Nature 411: 355–365. - PubMed
-
- Hochgrafe F, Zhang L, O'Toole SA, Browne BC, Pinese M, et al. (2010) Tyrosine phosphorylation profiling reveals the signaling network characteristics of Basal breast cancer cells. Cancer Res 70: 9391–9401. - PubMed
-
- Stommel JM, Kimmelman AC, Ying H, Nabioullin R, Ponugoti AH, et al. (2007) Coactivation of receptor tyrosine kinases affects the response of tumor cells to targeted therapies. Science 318: 287–290. - PubMed
-
- Hoe N, Park JO, Lee J, Park SH, Park YS, et al... (2011) A comprehensive profiling of mutation, pathway proteins and their modulation in response to drug treatment in panel of 39 gastric cancer cell lines Proceedings of the 102nd Annual Meeting of the American Association for Cancer Research, 2011 Abstract nr 2897 (2011).
MeSH terms
Substances
LinkOut - more resources
Full Text Sources
Other Literature Sources
Medical
Research Materials
Miscellaneous
