. 2013;8(1):e54689.
doi: 10.1371/journal.pone.0054689. Epub 2013 Jan 23.

Representation of ecological systems within the protected areas network of the Continental United States

Affiliations

Representation of ecological systems within the protected areas network of the Continental United States

Jocelyn L Aycrigg et al. PLoS One. 2013.

Abstract

If conservation of biodiversity is the goal, then the protected areas network of the continental US may be one of our best conservation tools for safeguarding ecological systems (i.e., vegetation communities). We evaluated representation of ecological systems in the current protected areas network and found insufficient representation at three vegetation community levels within lower elevations and moderate to high productivity soils. We used national-level data for ecological systems and a protected areas database to explore alternative ways we might be able to increase representation of ecological systems within the continental US. By following one or more of these alternatives it may be possible to increase the representation of ecological systems in the protected areas network both quantitatively (from 10% up to 39%) and geographically and come closer to meeting the suggested Convention on Biological Diversity target of 17% for terrestrial areas. We used the Landscape Conservation Cooperative framework for regional analysis and found that increased conservation on some private and public lands may be important to the conservation of ecological systems in Western US, while increased public-private partnerships may be important in the conservation of ecological systems in Eastern US. We have not assessed the pros and cons of following the national or regional alternatives, but rather present them as possibilities that may be considered and evaluated as decisions are made to increase the representation of ecological systems in the protected areas network across their range of ecological, geographical, and geophysical occurrence in the continental US into the future.


Conflict of interest statement

Competing Interests: The authors have declared that no competing interests exist.

Figures

Figure 1
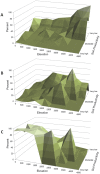
Figure 1. Percent area of ecological systems in relation to elevation, soil productivity, and protection status.
Protection status designations include lands managed to maintain biodiversity (A), lands managed for multiple-use (B), and lands that have no permanent protection (C). See Table 1 for protection status descriptions. Percent area of ecological systems determined by combining data for elevation (meters) and soil productivity (http://soils.usda.gov/technical/handbook) with ecological systems grouped by protection status , , .
Figure 2
Figure 2. Percent protected and available for each Level I land cover group by protection status.
Lands managed to maintain biodiversity (diamonds) are shown relative to lands managed to maintain biodiversity and for multiple-use (squares). See Table 1 for protection status descriptions. A comparison index line is shown, which indicates a 1∶1 relation between percent availability and percent protected . A value below the 1∶1 line represents a Level I land cover group under-represented in the protected areas network, a value above represents a Level I land cover group well represented in the protected areas network, while a value on the line indicates a Level I land cover group available and protected equally . For example, grassland, a Level I land cover group, has about 4% of its area managed to maintain biodiversity, but that increased to about 17% when lands managed for multiple-use were included , . A dashed line representing the 17% Aichi Biodiversity Target of the Convention on Biological Diversity is shown .
Figure 3
Figure 3. Percent area of Level II land cover groups by protection status.
The Level II land cover groups are arranged by Level I land cover groups (see Table S1) . Percent area for both lands managed to maintain biodiversity and lands managed for multiple-use are shown . See Table 1 for protection status descriptions. A dashed line representing the 17% Aichi Biodiversity Target of the Convention on Biological Diversity is shown .
Figure 4
Figure 4. Percent area of ecological systems by protection status.
Protection status designations are lands managed to maintain biodiversity (A) and lands managed to maintain biodiversity and multiple-use (B) for the continental US. Percent area is based on the area of each ecological system within each protection status divided by the total area of each ecological system , . See Table 1 for protection status descriptions. Only non-modified, non-aquatic ecological systems were included (n = 518; Table S1).
Figure 5
Figure 5. Area (ha) of Level I land cover groups by ownership and protection status.
Ownership includes federal, state, and local governments as well as private conservation lands. See Table 1 for protection status descriptions. These values were for the continental US. Both BLM and USFS have areas of Level I land cover groups that fall outside the scale on this graph , . Values for those Level I land cover groups are shown.
Figure 6
Figure 6. Redundancy, diversity, and uniqueness of ecological systems within Landscape Conservation Cooperatives (LCC).
Redundancy measures the number of LCC’s in which a single ecological system occurs (A) . The higher the number of LCC’s in which an ecological systems occurs the more redundancy displayed by that ecological system. For example, if an ecological system occurs in 2 LCCs, it has a redundancy value of 2. Diversity is the total number of ecological systems occurring with an LCC, which is shown by color shading of LCCs (B). Uniqueness is the number of ecological systems that occur in a single LCC, which is indicated by the number within each LCC (B). For example, the Great Northern LCC encompasses 126–150 ecological systems total, most of these occur in a total of 7 or 8 LCCs, but 3 are unique and only found in this LCC. Only non-modified, non-aquatic ecological systems were included (n = 518; Table S1). Each LCC is assigned a letter, which indicates the name of the LCC.
Figure 7
Figure 7. Number of ecological systems occurring only within each protection status by Landscape Conservation Cooperative (LCC).
Ecological systems included occur only within the specified protection status , . The total number of ecological systems within each LCC is shown parenthetically. For example, the Great Plains LCC contains 102 ecological systems with 18 occurring only on lands with no permanent protection and none occurring on lands managed to maintain biodiversity or for multiple-use. See Table 1 for protection status descriptions. Only non-modified, non-aquatic ecological systems are included (n = 518; Table S1).
Figure 8
Figure 8. Percent area of Landscape Conservation Cooperative (LCC) protected or converted and its conversion risk index (CRI).
CRI for each LCC is calculated by dividing percent area converted by percent area protected . The CRI index is shown for lands managed to maintain biodiversity (i.e., labeled maintain biodiversity) as well as for lands managed to maintain biodiversity and multiple-use (i.e., labeled multiple-use) . The LCCs are ordered by percent area within each protection status. See Table 1 for protection status descriptions. A dashed line representing the 17% Aichi Biodiversity Target of the Convention on Biological Diversity is shown .

Similar articles

Cited by

References

    1. Miller KR (1982) Parks and protected areas: considerations for the future. Ambio 11: 315–317.
    1. Pressey RL (1994) Ad hoc reservations: forward and backward steps in developing representative reserve systems? Conserv Biol 8: 662–668.
    1. Margules CR, Pressey RL (2000) Systematic conservation planning. Nature 405: 243–253. - PubMed
    1. Fairfax SK, Gwin L, King MA, Raymond L, Watt LA (2005) Buying nature: The limits of land acquisition as a conservation strategy, 1780–2004. Cambridge: The MIT Press. 357 p.
    1. Pressey RL, Humphries CJ, Margules CR, Vane-Wright RI, Williams PH (1993) Beyond opportunism: key principles for systematic reserve selection. Trends Ecol Evol 8: 124–128. - PubMed

Publication types

LinkOut - more resources