. 2013;8(1):e54785.
doi: 10.1371/journal.pone.0054785. Epub 2013 Jan 25.

Identification of temporal and region-specific myocardial gene expression patterns in response to infarction in swine

Affiliations

Identification of temporal and region-specific myocardial gene expression patterns in response to infarction in swine

Cristina Prat-Vidal et al. PLoS One. 2013.

Abstract

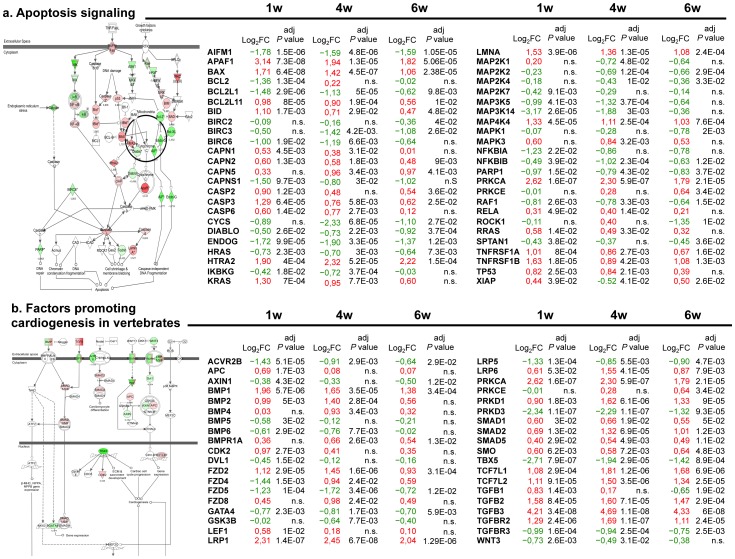
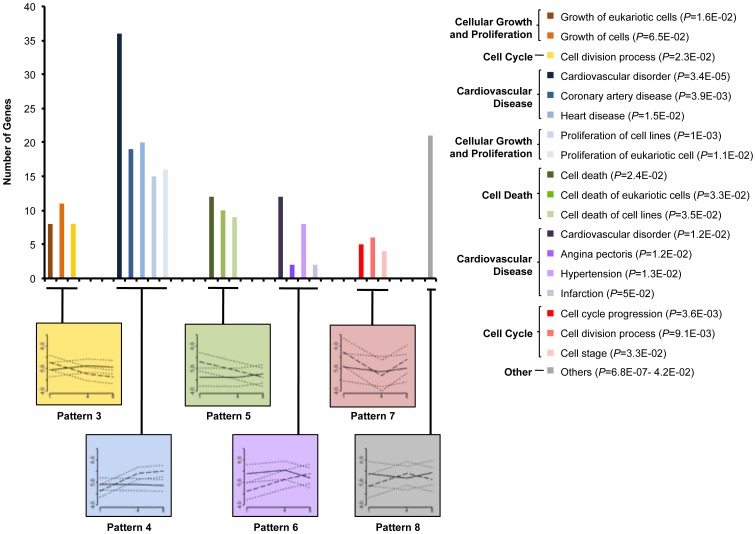
Molecular mechanisms associated with pathophysiological changes in ventricular remodelling due to myocardial infarction (MI) remain poorly understood. We analyzed changes in gene expression by microarray technology in porcine myocardial tissue at 1, 4, and 6 weeks post-MI.MI was induced by coronary artery ligation in 9 female pigs (30-40 kg). Animals were randomly sacrificed at 1, 4, or 6 weeks post-MI (n = 3 per group) and 3 healthy animals were also included as control group. Total RNA from myocardial samples was hybridized to GeneChip® Porcine Genome Arrays. Functional analysis was obtained with the Ingenuity Pathway Analysis (IPA) online tool. Validation of microarray data was performed by quantitative real-time PCR (qRT-PCR).More than 8,000 different probe sets showed altered expression in the remodelling myocardium at 1, 4, or 6 weeks post-MI. Ninety-seven percent of altered transcripts were detected in the infarct core and 255 probe sets were differentially expressed in the remote myocardium. Functional analysis revealed 28 genes de-regulated in the remote myocardial region in at least one of the three temporal analyzed stages, including genes associated with heart failure (HF), systemic sclerosis and coronary artery disease. In the infarct core tissue, eight major time-dependent gene expression patterns were recognized among 4,221 probe sets commonly altered over time. Altered gene expression of ACVR2B, BID, BMP2, BMPR1A, LMNA, NFKBIA, SMAD1, TGFB3, TNFRSF1A, and TP53 were further validated.The clustering of similar expression patterns for gene products with related function revealed molecular footprints, some of them described for the first time, which elucidate changes in biological processes at different stages after MI.


Conflict of interest statement

Competing Interests: The authors have declared that no competing interests exist.

Figures

Figure 1
Figure 1. Study design.
DEPS = differentially expressed probe sets; CM = control myocardium; IC = infarct core; RM = remote myocardium; qRT-PCR = quantitative real-time PCR.
Figure 2
Figure 2. Differentially clustered gene expression patterns in MI.
a Probe sets for genes significantly regulated (adjusted P value<0.05 by significance analysis of microarrays) at 1, 4, or 6 weeks post-MI were selected, clustered, and reported in a heat map. Each row represents a different probe set, and columns pertain to data collected at three temporal stages after surgery. Control myocardium from healthy animals was also included. Normalized data values, displayed in red and green shades, are represented according to the colour scale shown (bottom). b Venn diagrams summarizing similarities and differences between tissue regions at each temporal stage, using significant probe sets in a. IC = infarct core; RM = remote myocardium; w = weeks; n = 3 per group.
Figure 3
Figure 3. Altered canonical pathways in the infarct core tissue commonly identified at 1, 4, and 6 weeks post-MI (1).
IPA software recognized differentially expressed genes from five cardiovascular-related canonical pathways at the three temporal analyzed stages. Schematically representation at 1 week post-MI is detailed for a apoptosis signalling and b factors promoting cardiogenesis canonical pathways (left panels), showing both upregulated and downregulated molecules (red or green filled, respectively). Genes with their corresponding log2 FC and adjusted P value at 1, 4, and 6 weeks post-MI are also listed. w = weeks; red value = upregulated gene; green value = downregulated gene.
Figure 4
Figure 4. Top temporal patterns, comprising the majority of differentially expressed genes in infarct core tissue, clustered within function categories.
a Probe sets with a similar sustained expression over time in infarct core are shown depending on the regular upregulation (pattern 1, graph framed in red) or downregulation (pattern 2, graph framed in green). In both graphs, mean of log2 FC for probe sets with 95% CI were plotted. Solid line = remote myocardium, dashed line = infarct core and dotted lines = 95% CI for mean. X axis relates to weeks and Y axis relates to log2 FC. b Heat maps of functional clusters from patterns, comparing remote myocardium and infarct core gene expressions. Each row represents a different probe set, and columns pertain to remote myocardium or infarct core samples at temporal stages specified. P value range and number of molecules pertaining to each function category identified by IPA are detailed. IC = infarct core; RM = remote myocardium; w = weeks.
Figure 5
Figure 5. Secondary temporal patterns of differentially expressed genes in infarct core tissue clustered within functional groups.
Representative categories, divided in function annotations, are plotted. Related temporal expression patterns of the original probe sets over time are also showed in the corresponding graphs at bottom. For each temporal pattern, mean of log2 FC for probe sets with 95% CI were computed. Solid line = remote myocardium, dashed line = infarct core and dotted lines = 95% CI for mean. X axis relates to weeks and Y axis relates to log2 FC. P value ranges for function annotations are included in the graph legend.
Figure 6
Figure 6. Fold change comparison based on qRT-PCR results and microarray expression data for ten selected genes in the infarct core region.
qRT-PCR gene expression signals were normalized to PGK1 housekeeping gene. Data represents mean ± sd of log2 FC. Scatter plots of −ΔCt qRT-PCR and microarray log2 FC expression with regression lines and Spearman's correlation were showed at 1, 4, and 6 weeks post-MI. FC = fold change.

References

    1. Fishbein MC, Maclean D, Maroko PR (1978) The histopathologic evolution of myocardial infarction. Chest 73: 843–849. - PubMed
    1. Pfeffer MA, Braunwald E (1990) Ventricular remodeling after myocardial infarction. Experimental observations and clinical implications. Circulation 81: 1161–1172. - PubMed
    1. Anversa P, Li P, Zhang X, Olivetti G, Capasso JM (1993) Ischaemic myocardial injury and ventricular remodelling. Cardiovasc Res 27: 145–157. - PubMed
    1. Sutton MG, Sharpe N (2000) Left ventricular remodeling after myocardial infarction: pathophysiology and therapy. Circulation 101: 2981–2988. - PubMed
    1. Stanton LW, Garrard LJ, Damm D, Garrick BL, Lam A, et al. (2000) Altered patterns of gene expression in response to myocardial infarction. Circ Res 86: 939–945. - PubMed

Publication types

Associated data