

Multiple breast cancer cell-lines derived from a single tumor differ in their molecular characteristics and tumorigenic potential
- PMID: 23372829
- PMCID: PMC3555897
- DOI: 10.1371/journal.pone.0055145
Multiple breast cancer cell-lines derived from a single tumor differ in their molecular characteristics and tumorigenic potential
Abstract
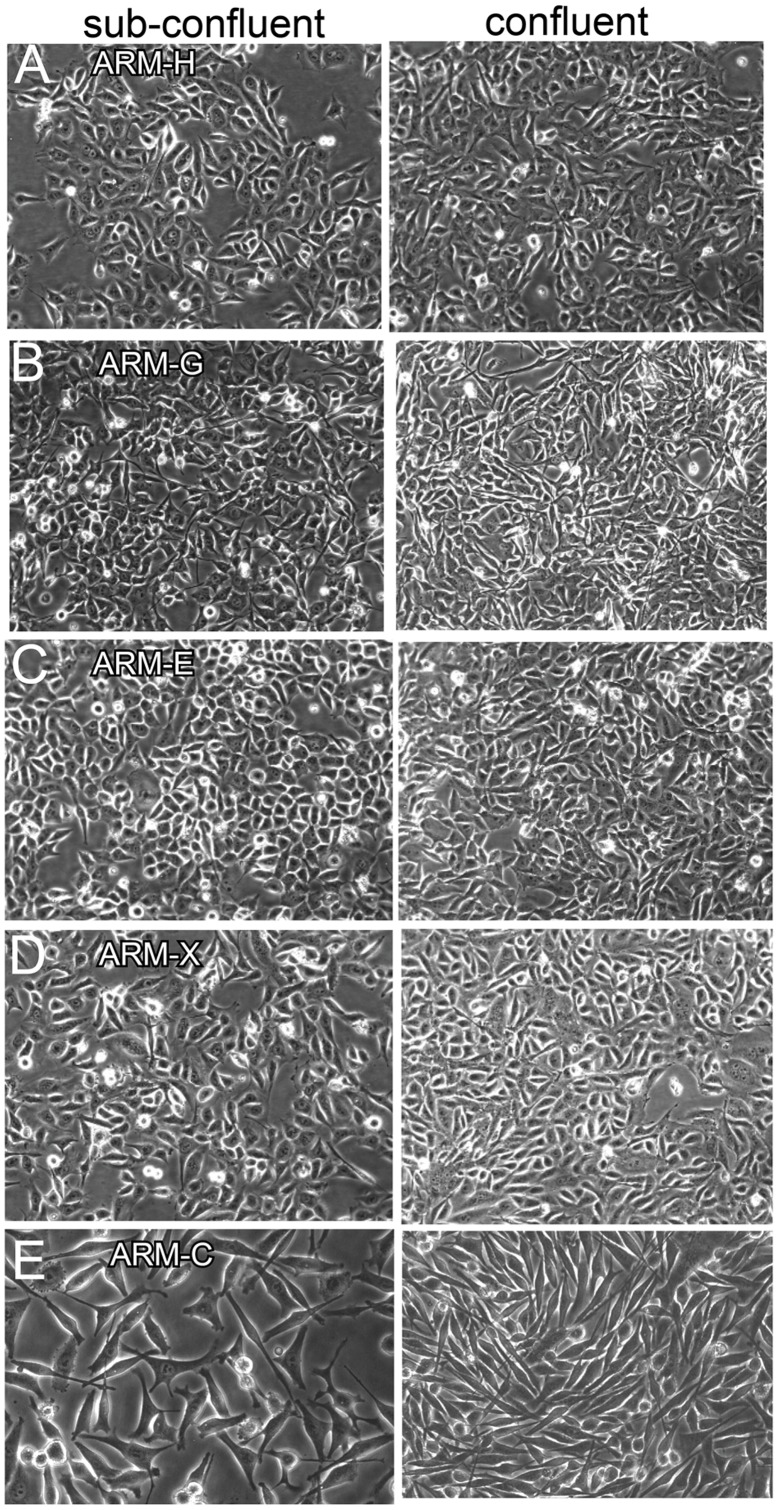
Background: Breast cancer cell lines are widely used tools to investigate breast cancer biology and to develop new therapies. Breast cancer tissue contains molecularly heterogeneous cell populations. Thus, it is important to understand which cell lines best represent the primary tumor and have similarly diverse phenotype. Here, we describe the development of five breast cancer cell lines from a single patient's breast cancer tissue. We characterize the molecular profiles, tumorigenicity and metastatic ability in vivo of all five cell lines and compare their responsiveness to 4-hydroxytamoxifen (4-OHT) treatment.
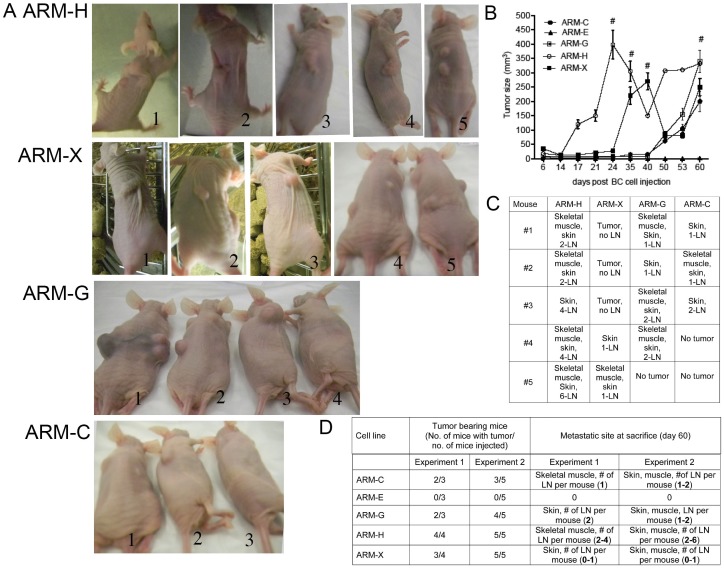
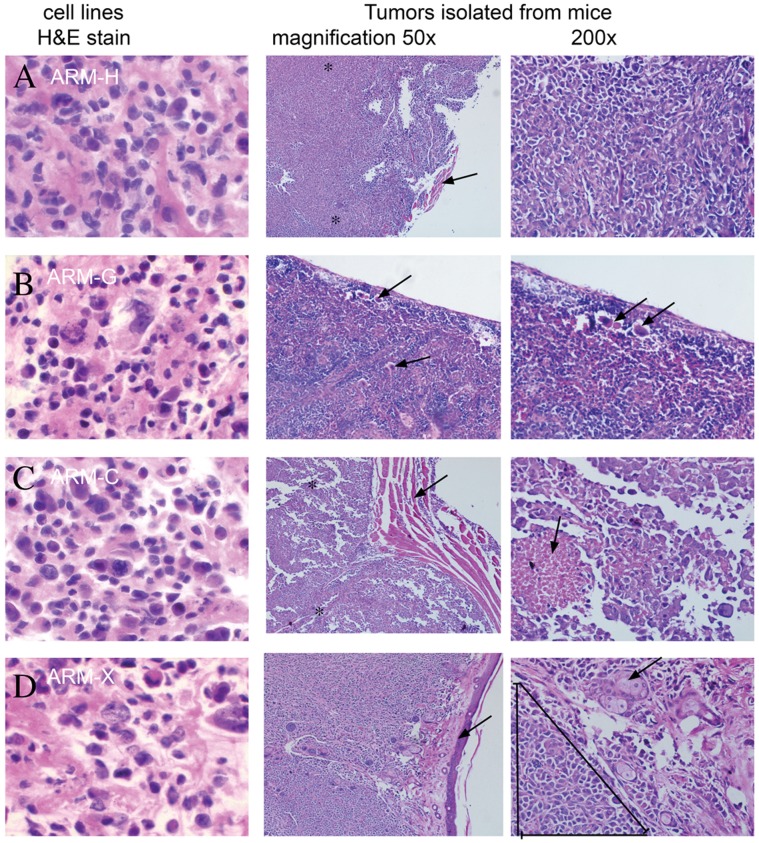
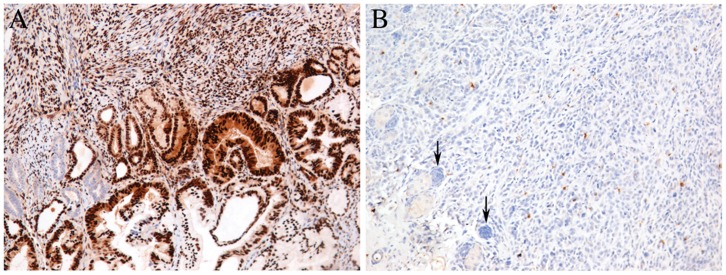
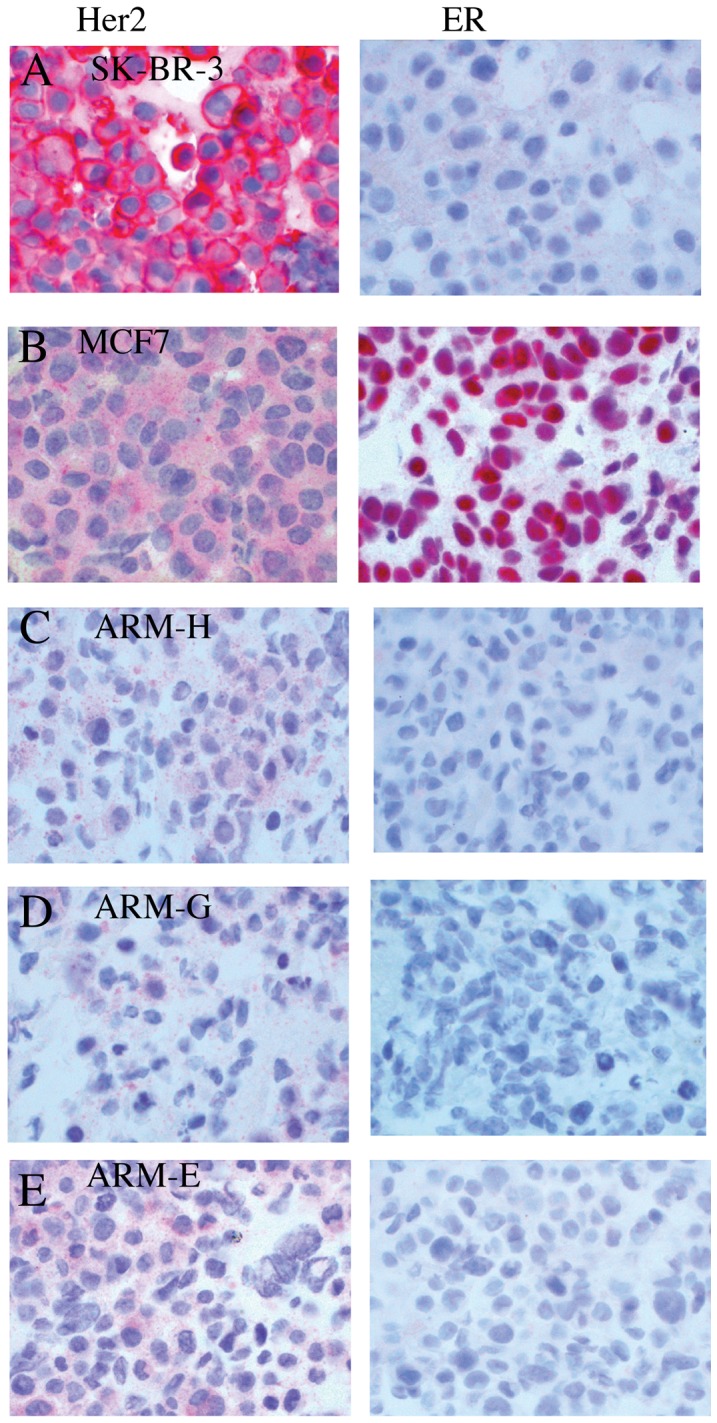
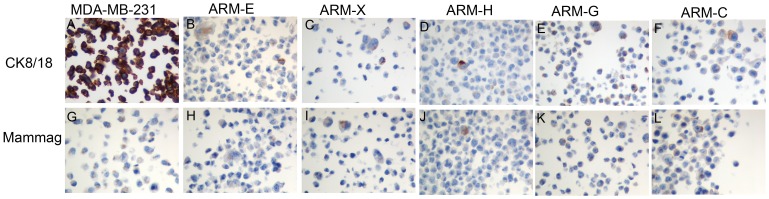
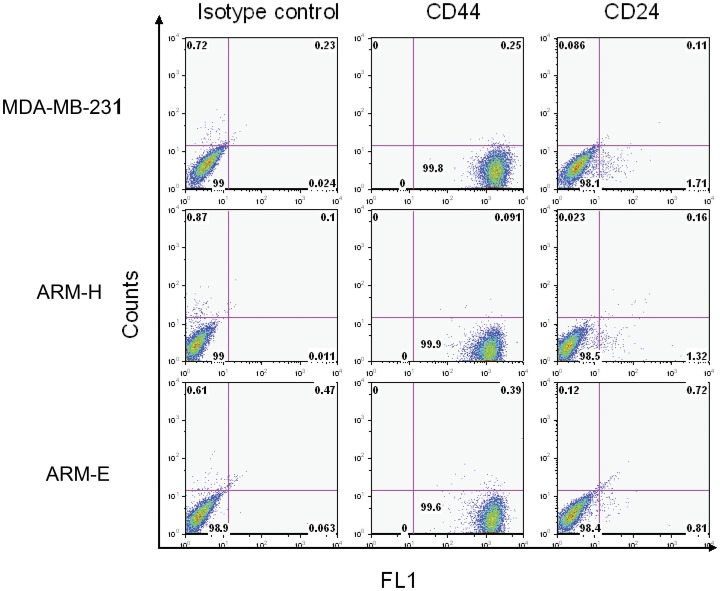
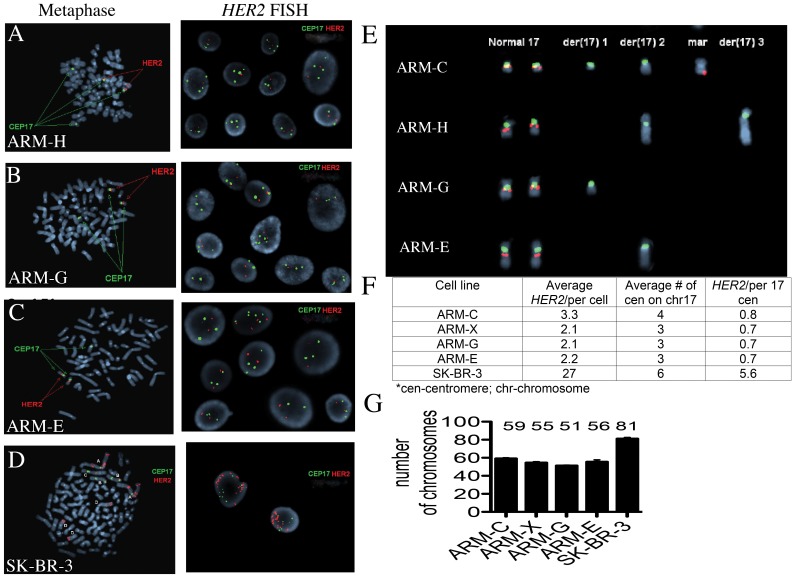
Methods: Five breast cancer cell lines were derived from a single patient's primary breast cancer tissue. Expression of different antigens including HER2, estrogen receptor (ER), CK8/18, CD44 and CD24 was determined by flow cytometry, western blotting and immunohistochemistry (IHC). In addition, a Fluorescent In Situ Hybridization (FISH) assay for HER2 gene amplification and p53 genotyping was performed on all cell lines. A xenograft model in nude mice was utilized to assess the tumorigenic and metastatic abilities of the breast cancer cells.
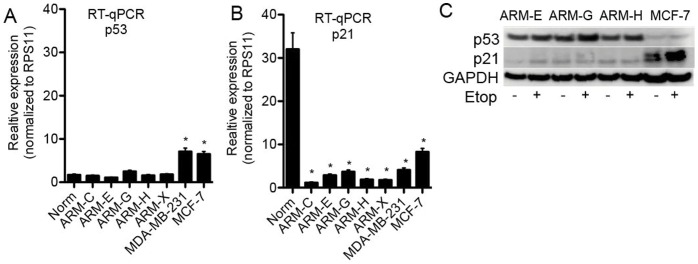
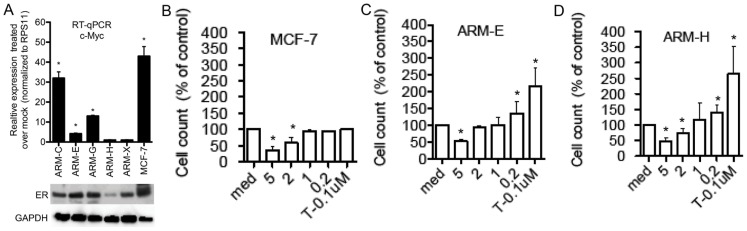
Results: We have isolated, cloned and established five new breast cancer cell lines with different tumorigenicity and metastatic abilities from a single primary breast cancer. Although all the cell lines expressed low levels of ER, their growth was estrogen-independent and all had high-levels of expression of mutated non-functional p53. The HER2 gene was rearranged in all cell lines. Low doses of 4-OHT induced proliferation of these breast cancer cell lines.
Conclusions: All five breast cancer cell lines have different antigenic expression profiles, tumorigenicity and organ specific metastatic abilities although they derive from a single tumor. None of the studied markers correlated with tumorigenic potential. These new cell lines could serve as a model for detailed genomic and proteomic analyses to identify mechanisms of organ-specific metastasis of breast cancer.
Conflict of interest statement
Figures
Similar articles
-
p53 status influences response to tamoxifen but not to fulvestrant in breast cancer cell lines.Int J Cancer. 2011 Apr 15;128(8):1813-21. doi: 10.1002/ijc.25512. Int J Cancer. 2011. PMID: 20549698
-
Patient-derived luminal breast cancer xenografts retain hormone receptor heterogeneity and help define unique estrogen-dependent gene signatures.Breast Cancer Res Treat. 2012 Sep;135(2):415-32. doi: 10.1007/s10549-012-2164-8. Epub 2012 Jul 24. Breast Cancer Res Treat. 2012. PMID: 22821401 Free PMC article.
-
HER2-associated radioresistance of breast cancer stem cells isolated from HER2-negative breast cancer cells.Clin Cancer Res. 2012 Dec 15;18(24):6634-47. doi: 10.1158/1078-0432.CCR-12-1436. Epub 2012 Oct 22. Clin Cancer Res. 2012. PMID: 23091114 Free PMC article.
-
Epithelial mesenchymal transition traits in human breast cancer cell lines parallel the CD44(hi/)CD24 (lo/-) stem cell phenotype in human breast cancer.J Mammary Gland Biol Neoplasia. 2010 Jun;15(2):235-52. doi: 10.1007/s10911-010-9175-z. Epub 2010 Jun 4. J Mammary Gland Biol Neoplasia. 2010. PMID: 20521089 Review.
-
Choosing the right cell line for breast cancer research.Breast Cancer Res. 2011 Aug 12;13(4):215. doi: 10.1186/bcr2889. Breast Cancer Res. 2011. PMID: 21884641 Free PMC article. Review.
Cited by
-
Isolation and characterization of a new naturally immortalized human breast carcinoma cell line, KAIMRC1.BMC Cancer. 2017 Nov 29;17(1):803. doi: 10.1186/s12885-017-3812-5. BMC Cancer. 2017. PMID: 29187162 Free PMC article.
-
Identification of CCNB2 as A Potential Non-Invasive Breast Cancer Biomarker in Peripheral Blood Mononuclear Cells Using The Systems Biology Approach.Cell J. 2021 Sep;23(4):406-413. doi: 10.22074/cellj.2021.7053. Epub 2021 Aug 29. Cell J. 2021. PMID: 34455715 Free PMC article.
-
Immunologically "cold" triple negative breast cancers engraft at a higher rate in patient derived xenografts.NPJ Breast Cancer. 2022 Sep 10;8(1):104. doi: 10.1038/s41523-022-00476-0. NPJ Breast Cancer. 2022. PMID: 36088362 Free PMC article.
-
Tamoxifen induces a pluripotency signature in breast cancer cells and human tumors.Mol Oncol. 2015 Nov;9(9):1744-59. doi: 10.1016/j.molonc.2015.05.008. Epub 2015 Jun 5. Mol Oncol. 2015. PMID: 26115764 Free PMC article.
-
Oestrogen Receptor Isoforms May Represent a Therapeutic Target in Oesophageal Adenocarcinoma.Cancers (Basel). 2022 Apr 8;14(8):1891. doi: 10.3390/cancers14081891. Cancers (Basel). 2022. PMID: 35454796 Free PMC article.
References
-
- Massarweh S, Osborne CK, Creighton CJ, Qin L, Tsimelzon A, et al. (2008) Tamoxifen resistance in breast tumors is driven by growth factor receptor signaling with repression of classic estrogen receptor genomic function. Cancer Res 68: 826–833. - PubMed
-
- Duong V, Boulle N, Daujat S, Chauvet J, Bonnet S, et al. (2007) Differential regulation of estrogen receptor alpha turnover and transactivation by Mdm2 and stress-inducing agents. Cancer Res 67: 5513–5521. - PubMed
-
- Fernandez-Cuesta L, Anaganti S, Hainaut P, Olivier M (2010) p53 status influences response to tamoxifen but not to fulvestrant in breast cancer cell lines. Int J Cancer. - PubMed
Publication types
MeSH terms
Substances
LinkOut - more resources
Full Text Sources
Other Literature Sources
Medical
Molecular Biology Databases
Research Materials
Miscellaneous
