. 2013 May 15;4(5):729-36.
doi: 10.1021/cn300199m. Epub 2013 Jan 29.

In vivo calibration of microdialysis using infusion of stable-isotope labeled neurotransmitters

Affiliations

In vivo calibration of microdialysis using infusion of stable-isotope labeled neurotransmitters

Neil D Hershey et al. ACS Chem Neurosci. .

Abstract

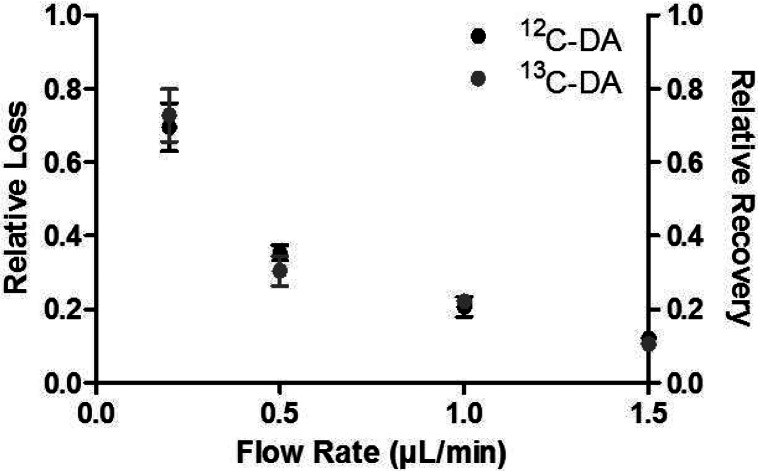
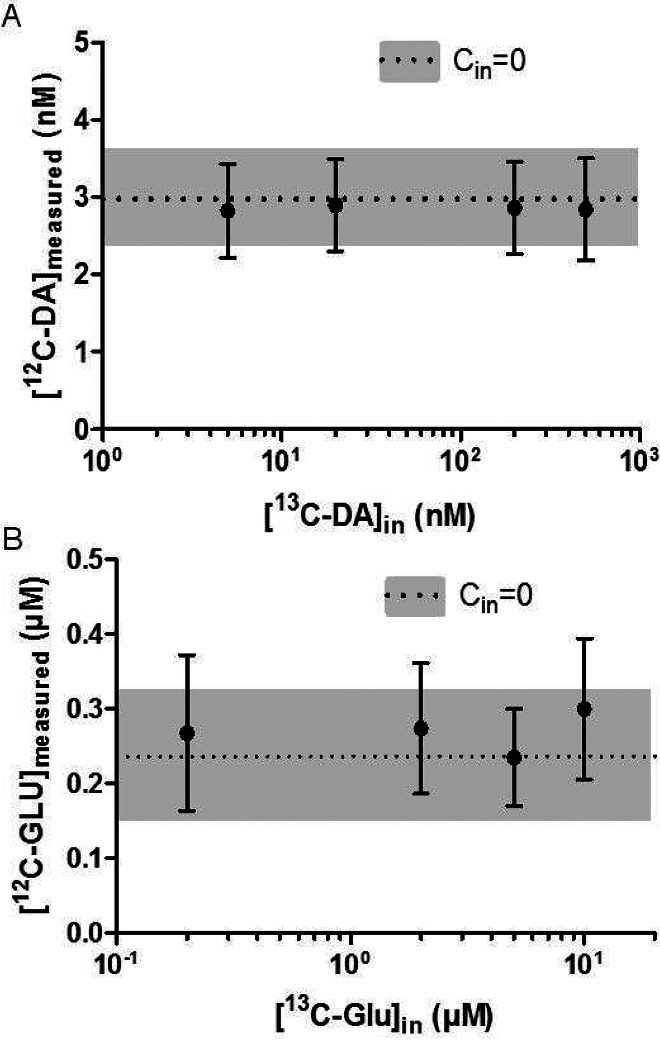
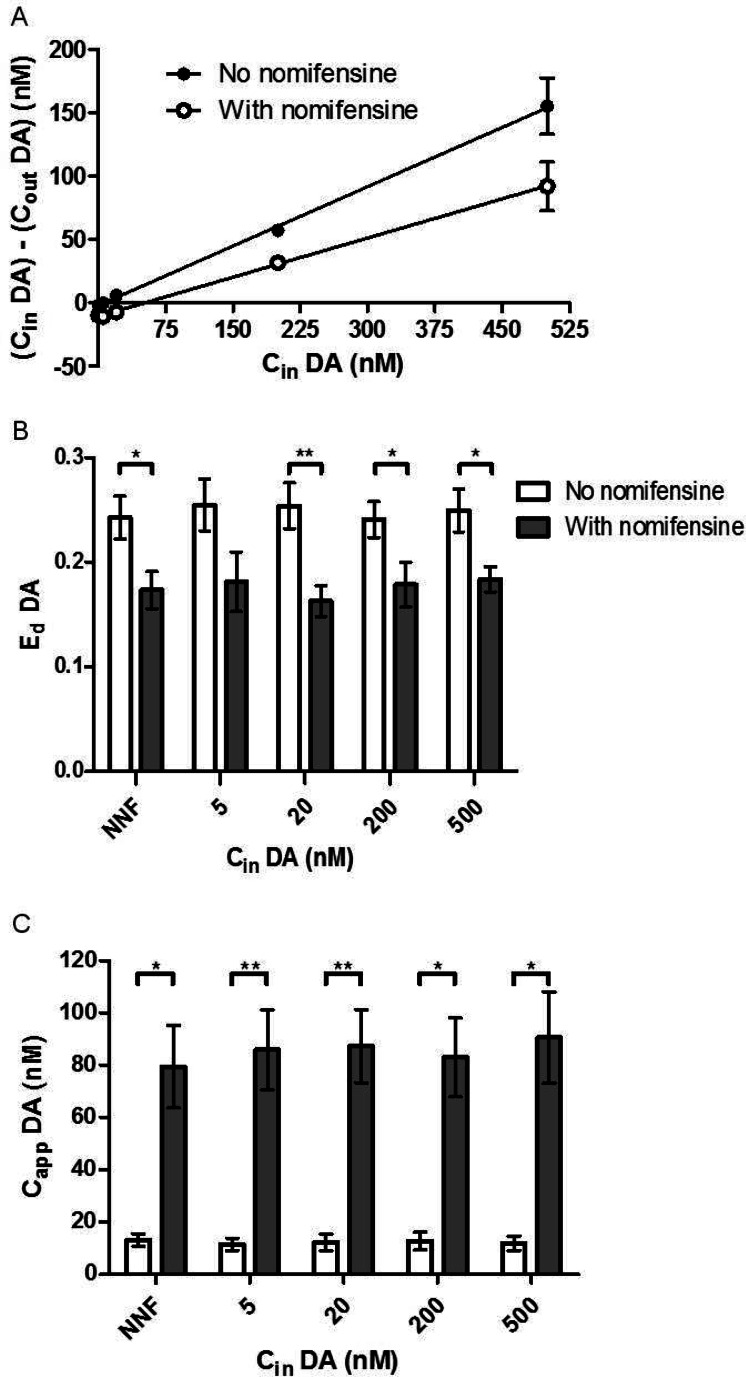
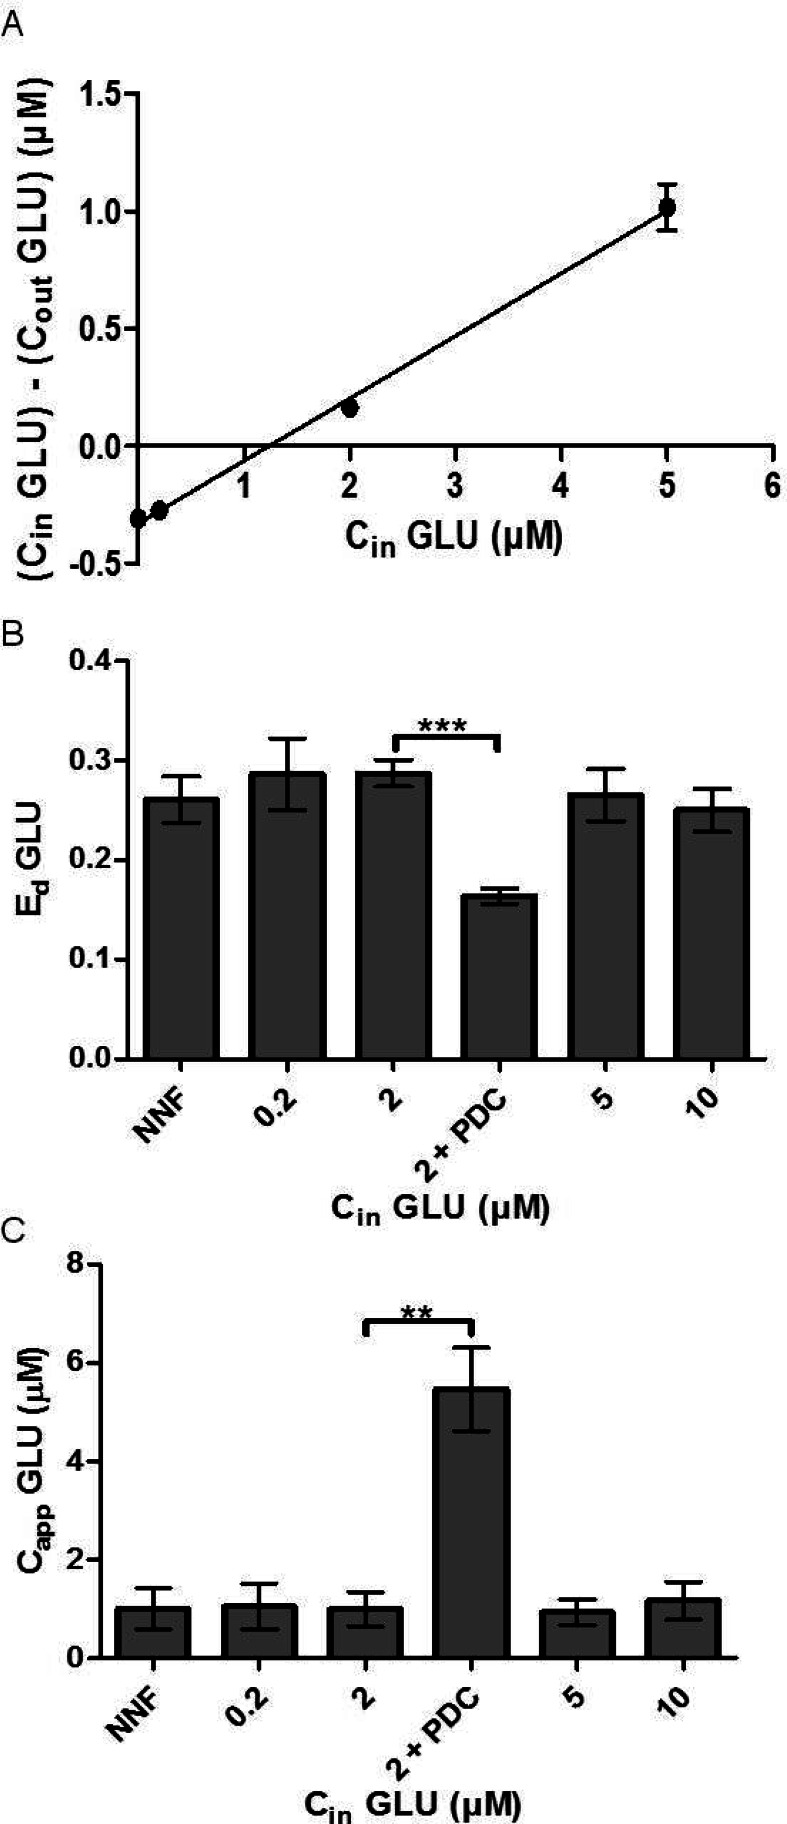
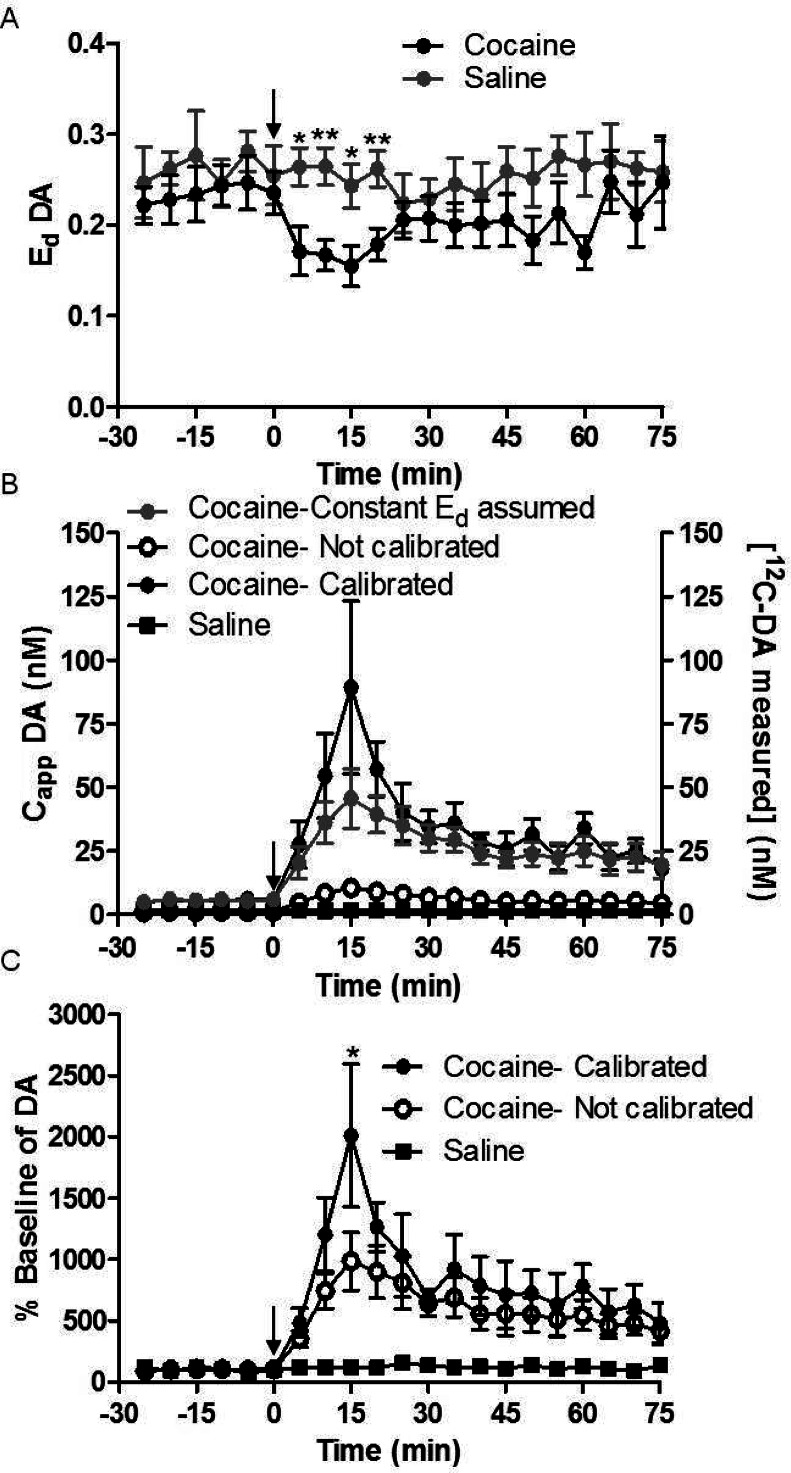
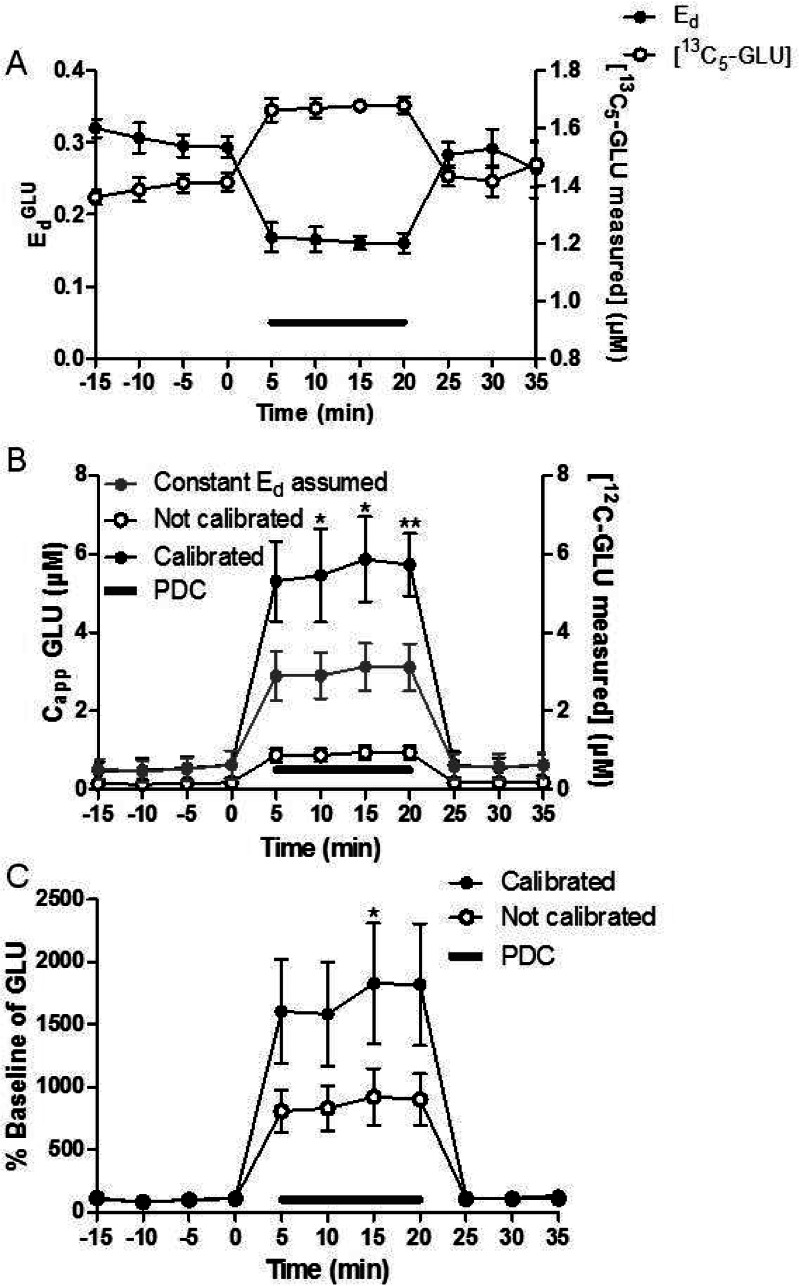
In vivo calibration of microdialysis probes is required for interpreting measured concentrations. The most popular method of in vivo calibration is no-net-flux (NNF), which requires infusing several concentrations of neurotransmitters to determine in vivo recoveries (extraction fraction or Ed) and extracellular concentrations. A new method for in vivo calibration of microdialysis of neurotransmitters using glutamate (GLU) and dopamine (DA) as model analytes is reported. (13)C6-DA and (13)C5-GLU were perfused through microdialysis probes as internal calibrators. Using liquid chromatography with mass spectrometry, it was possible to distinguish the (13)C-forms from the endogenous forms of each neurotransmitter. Ed was directly calculated by measuring the loss of the (13)C-forms during infusion. The measured endogenous (12)C forms of the neurotransmitters could be corrected for Ed to give calibrated extracellular concentrations in vivo. Retrodialysis of stable-isotope-labeled (SIL) neurotransmitters gave Ed and extracellular concentrations of (13)C5-GLU and (13)C6-DA that matched no-net-flux measurements; however, the values were obtained in a fraction of time because no added measurements were required to obtain the calibration. Ed was reduced during uptake inhibition for GLU and DA when measured by SIL retrodialysis. Because Ed is directly measured at each microdialysis fraction, it was possible to monitor changes in Ed under transient conditions created by systemic injection of uptake inhibitors. The results show that DA and GLU concentrations are underestimated by as much as 50% if not corrected for Ed during uptake inhibition. SIL retrodialysis provides equivalent information to NNF at much reduced time and animal use.


Figures

Figure 1
Figure 1
200 nM 13C6-DA was perfused through the probe sitting in a well stirred vial of 200 nM 12C-DA. The loss of the 13C6-DA was compared to the recovery of the 12C-DA across four flow rates (0.2, 0.5, 1.0, and 1.5 μL/min). The recovery matched the loss at each flow rate, showing diffusion rates in vitro are equal.
Figure 2
Figure 2
(A) When varying concentrations of 13C6-DA perfused through the probe, 12C-DA measured remained constant. The dotted line indicates the CoutDA when CinDA = 0, and the gray bars represent the SEM with no 13C6-DA perfused (N = 5, error bars are SEM). (B) Perfusing up to 10 μM 13C5-GLU had no effect on the endogenous concentration of GLU. The dotted line and gray bar indicate CoutGLU when CinGLU = 0. N = 5, error bars show SEM.
Figure 3
Figure 3
(A) A representative NNF curve from one rat shows how perfusing nomifensine through the probe (black open circles), EdDA (the slope) reduces and CappDA increases (x-intercept) compared to no nomifensine (black solid circles). Cin consisted of varying concentrations of 13C6-DA. Cout was measured by summing the total DA measured (the 12C and 13C form). (B) EdDA was compared between SIL retrodialysis calibration and NNF calibration. Nomifensine, a DA uptake inhibitor, was perfused through the probe to demonstrate the reduction of EdDA. (C) CappDA was also calculated using eq 2. At all concentrations of 13C6-DA perfused, CappDA and EdDA matched the NNF values. Error bars show SEM (n = 5 for each group). Paired t tests were used for comparison. ** indicates p-value < 0.01, and * indicates p-value < 0.05.
Figure 4
Figure 4
(A) Sample NNF curve is shown when perfusing varying concentrations of 13C5-GLU through the probe. Cout was calculated by summing [13C5-GLU measured] and [12C-GLU measured]. (B) SIL retrodialysis was compared to NNF to measure EdGLU. EdGLU SIL retrodialysis values matched that of the NNF values. 750 μM PDC was perfused with 2 μM 13C6-DA, which decreased EdGLU (p < 0.001, unpaired t test). (C) EdGLU and [12C-GLU measured] were used to calculate CappGLU. CappGLU for SIL retrodialysis matched CappGLU measured by NNF. After perfusion of 750 μM PDC, CappGLU increased 550% (p-value < 0.001). Error bars show SEM (n = 5 except for PDC infusion, n = 4).
Figure 5
Figure 5
(A) EdDA was measured during a cocaine challenge. At t = 0, cocaine (20 mg/kg i.p., black solid circles) or saline (gray solid circles) was administered. EdDA was reduced by 35% (p-value < 0.005) in the presence of cocaine compared to saline. (B) [12C-DA measured] (right axis, black open circles), CappDA with a constant EdDA assumed (EdDA measured prior to cocaine injection, gray solid circles), and CappDA measured with SIL retrodialysis calibration (black solid circles) are shown when cocaine was administered. [12C-DA measured] was also measured after saline injection (right axis, black solid squares). N = 7 for each group, saline and cocaine. CappDA was an average of 160% greater than CappDA with constant EdDA for the first 20 min (p-value < 0.001). (C) Calibrated (black solid circles) and conventional (black open circles) microdialysis was measured in % basal of 12C-DA after cocaine injection. Using the mixed model regression, there was an average 200% increase in % basal of calibrated vs not-calibrated (p-value < 0.001). Paired t tests show significance of individual fractions. Saline produced no change in DA (black solid squares). N = 7 and error bars show SEM. ** indicates p-value < 0.01, and * indicates p-value < 0.05.
Figure 6
Figure 6
(A) EdGLU was measured as 750 μM PDC was perfused (gray line) through the probe. EdGLU (black solid circles) values reached the minimum value within 5 min (p-value < 0.001 compared to aCSF). With 2 μM 13C5-GLU perfused through the probe, the addition of PDC to the perfusate increased [13C5-GLU measured] (right axis, black open circles). (B) [12C-GLU measured] (right axis, black open circles), CappGLU with constant EdGLU assumed (EdGLU measured prior to PDC, gray solid circles), and CappGLU (black solid circles) were measured as PDC was perfused. CappGLU was on average 190% higher compared to CappGLU with a constant EdGLU assumed (p-value < 0.001). (C) % baseline of GLU for calibrated (black solid circles) vs conventional (black open circles) microdialysis is shown. The calibrated measurements were 200% larger compared to the conventional microdialysis (p-value < 0.001). Paired t tests were used for individual fractions to test significance as well. Error bars show SEM (n = 4). ** indicates p-value < 0.01, and * indicates p-value < 0.05.

Similar articles

Cited by

References

    1. Chefer V. I.; Zapata A.; Shippenberg T. S.; Bungay P. M. (2006) Quantitative no-net-flux microdialysis permits detection of increases and decreases in dopamine uptake in mouse nucleus accumbens. J. Neurosci. Methods 155, 187–193. - PubMed
    1. Bungay P. M.; Morrison P. F.; Dedrick R. L. (1990) Steady-state theory for quantitative microdialysis of solutes and water in vivo and in vitro. Life Sci. 46, 105–119. - PubMed
    1. Yim H. J.; Gonzales R. A. (2000) Ethanol-induced increases in dopamine extracellular concentration in rat nucleus accumbens are accounted for by increased release and not uptake inhibition. Alcohol 22, 107–115. - PubMed
    1. Bungay P. M.; Newton-Vinson P.; Isele W.; Garris P. A.; Justice J. B. (2003) Microdialysis of dopamine interpreted with quantitative model incorporating probe implantation trauma. J. Neurochem. 86, 932–946. - PMC - PubMed
    1. Jaquins-Gerstl A.; Shu Z.; Zhang J.; Liu Y.; Weber S. G.; Michael A. C. (2011) Effect of Dexamethasone on Gliosis, Ischemia, and Dopamine Extraction during Microdialysis Sampling in Brain Tissue. Anal. Chem. 83, 7662–7667. - PMC - PubMed

Publication types

LinkOut - more resources