. 2013 Jan 31;152(3):543-56.
doi: 10.1016/j.cell.2012.12.032.

Conformational coupling across the plasma membrane in activation of the EGF receptor

Affiliations

Conformational coupling across the plasma membrane in activation of the EGF receptor

Nicholas F Endres et al. Cell. .

Abstract

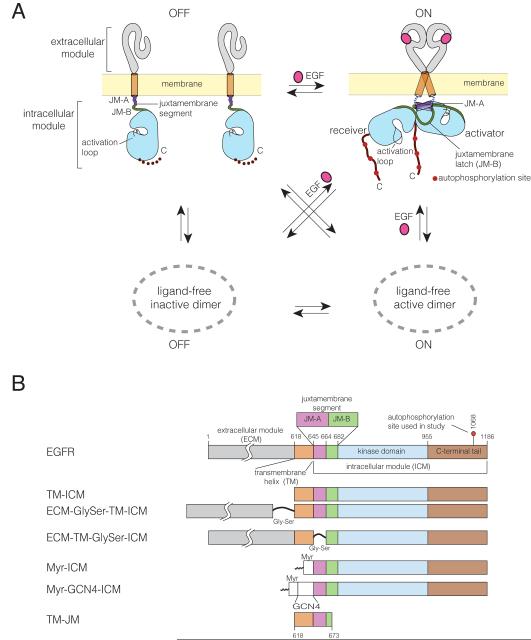
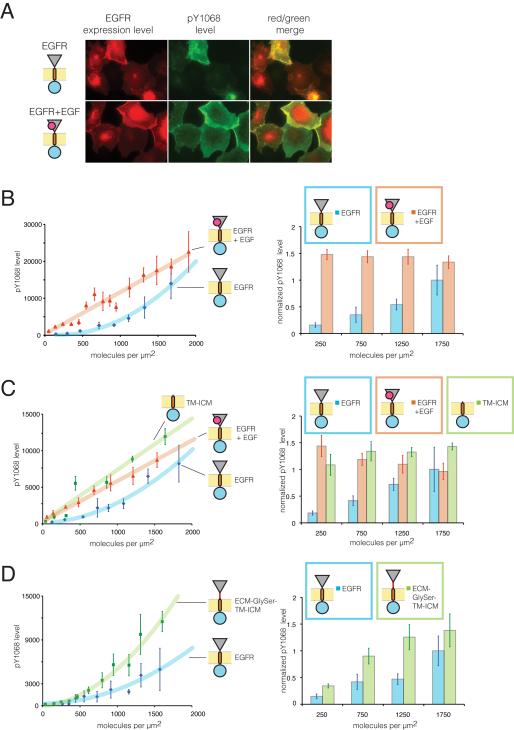
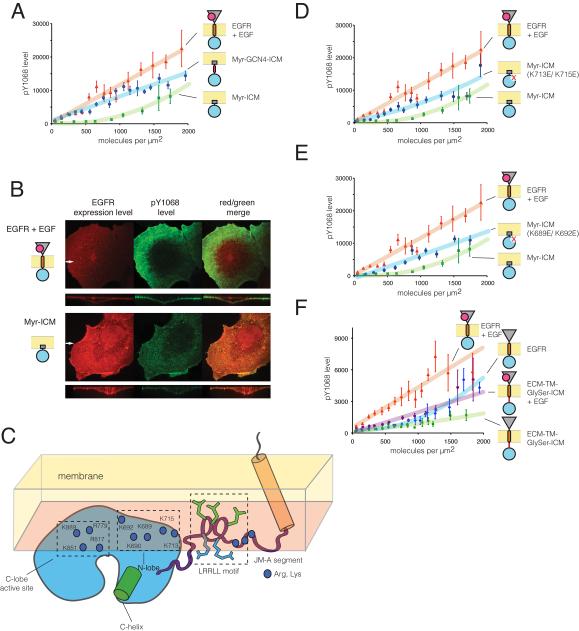
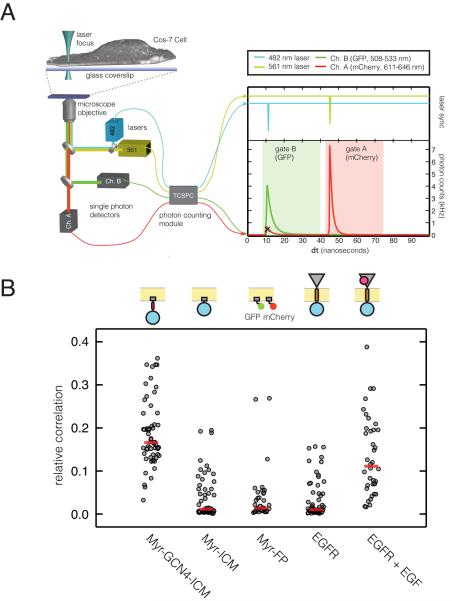
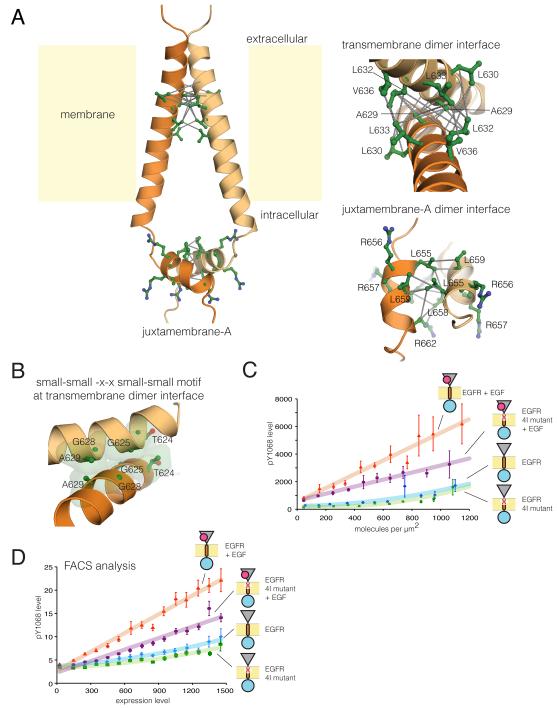
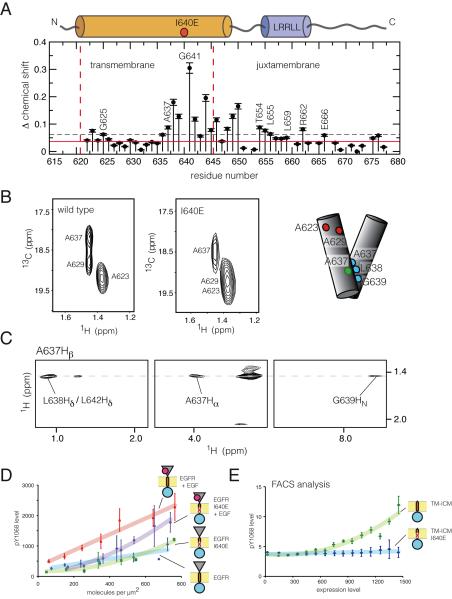
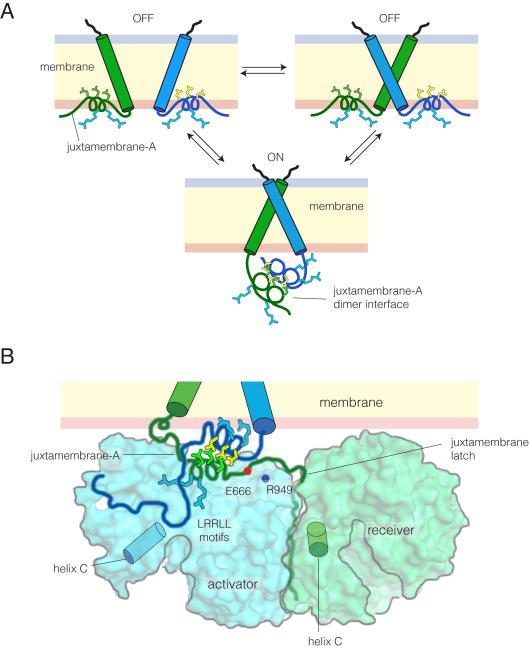
How the epidermal growth factor receptor (EGFR) activates is incompletely understood. The intracellular portion of the receptor is intrinsically active in solution, and to study its regulation, we measured autophosphorylation as a function of EGFR surface density in cells. Without EGF, intact EGFR escapes inhibition only at high surface densities. Although the transmembrane helix and the intracellular module together suffice for constitutive activity even at low densities, the intracellular module is inactivated when tethered on its own to the plasma membrane, and fluorescence cross-correlation shows that it fails to dimerize. NMR and functional data indicate that activation requires an N-terminal interaction between the transmembrane helices, which promotes an antiparallel interaction between juxtamembrane segments and release of inhibition by the membrane. We conclude that EGF binding removes steric constraints in the extracellular module, promoting activation through N-terminal association of the transmembrane helices.


Figures

Figure 1
Figure 1. Model for EGFR Activation and Domain Architecture
(A) Model for monomer-dimer equilibrium of EGFR in the absence and presence of EGF (Yarden and Schlessinger, 1987). (B) EGFR constructs used in this study.
Figure 2
Figure 2
Surface-Density Dependence of EGFR Activation (See also Figure S1) (A) Fluorescence microscopy images of EGFR fused to mCherry expressed in Cos-7 cells (left panels, red) compared to phosphorylation level of EGFR at Tyr 1068 (middle panels, green, merged with expression in right panels). In bottom panels, cells were treated with EGF for 3 minutes at 37°C prior to fixation (Experimental Procedures). (B) Relationship between EGFR surface density and phosphorylation level. In the left panel, individual data points represent the mean surface density and the mean phosphorylation level for selected cells with comparable surface density (within 100 molecules per μm2 of the mean value). Trend lines were calculated using linear and second-order polynomial fits for EGFR with and without ligand, respectively. In the right panel, bars represent the mean ratio of phosphorylation level to surface density for all cells within equal ranges of surface densities (value on x-axis ± 250 molecules per μm2). In these diagrams, as well as all subsequent ones, error bars represent the standard error of the mean. (C) Surface density-dependent phosphorylation for a construct with extracellular domain deleted (TM-ICM) compared to EGFR ± EGF. (D) Surface density-dependent phosphorylation levels for a construct with a flexible linker inserted between the extracellular module and the transmembrane (ECM-GlySer-TMICM) compared to EGFR.
Figure 3
Figure 3. Activity of the Intracellular Module Localized to the Plasma Membrane with the c-Src Motif (See also Figures S2 and S3)
(A) Surface-density dependence of phosphorylation for Myr-ICM compared to EGF-treated EGFR and Myr-GCN4-ICM. (B) Confocal fluorescence microscopy images of cells expressing EGFR (top panels) or the intracellular module fused to a c-Src membrane localization motif (Myr-ICM, bottom panels), showing expression levels (left panels, red) and antibody detection of phosphorylation at Tyr 1068 (middle panels, green, merge with expression in right panels). Large panels are images in the x-y plane of the basal surface of the cells (closest to the coverslip). Smaller panels are projections in the x-z plane, orthogonal to the basal surface, at the y-coordinate indicated by the white arrow. Note that while expression of Myr-ICM is higher than EGFR, its phosphorylation level is significantly lower. (C) Schematic model for docking of the EGFR kinase domain against the plasma membrane based on molecular dynamics simulations of unliganded EGFR in lipid bilayers (Arkhipov et al.). In the kinase domain, positively charged residues that interact with negative charged lipids during the simulations are labeled and shown as blue dots. The LRRLL motif in the JM-A segment is shown in stick form, with leucines in green and arginines in blue. (D) Surface-density dependence of phosphorylation for charge reversal mutations in the N-lobe interaction region of the intracellular domain (Myr-ICM K713E/K715E), compared to Myr-ICM and EGF-treated EGFR. (E) Surface-density dependence of phosphorylation for another set of charge reversal mutations in the N-lobe (Myr-ICM K689E/K692E), compared to Myr-ICM and EGF-treated EGFR. The data for EGFR and Myr-ICM is same as in Figure 3D, since samples were prepared on the same day. (F) Surface-density dependence of phosphorylation for ECM-TM-GlySer-ICM and EGFR in the absence and presence of EGF.
Figure 4
Figure 4. Fluorescence Cross-Correlation Spectroscopy Data for EGFR Constructs on the Plasma Membrane (See also Figure S4)
(A) Schematic of laser excitation and fluorescence detection for two-color pulsed interleaved excitation fluorescence cross-correlation spectroscopy (PIE-FCCS, left). Pulse diagram (right) showing excitation pulses (top panel, with GFP in blue and mCherry in green) and emission (bottom panel, with GFP in green and mCherry in red) is shown. Note that time gating allows us to eliminate mCherry emission when GFP is excited. (B) Relative cross-correlation values for various EGFR constructs. Myr-FP is a coexpression of GFP and mCherry each fused separately to the c-Src membrane localization motif. Data are represented as a scatter plot, with the red line representing the median value. Surface densities of EGFR constructs ranged from 100 - 1000 molecules per μm2.
Figure 5
Figure 5. NMR Structure of Transmembrane-Juxtamembrane Dimer in Bicelles and Role of N-terminal Dimer Interface in Receptor Activation (See also Figure S5 and S7)
(A) Structural model of the transmembrane-juxtamembrane segment of EGFR in DMPC/DHPC bicelles as determined from NMR data. Intermolecular NOESY connectivities are shown with grey lines. Dimer interfaces are expanded in the right panels. (B) Expanded view of the transmembrane dimer interface with residues in the small-small-x-x-small-small motif highlighted. (C) Surface-density dependence of phosphorylation for EGFR with four residues in the N-terminal interface mutated (4I, T624I/G625I/G628I/A629I). Both wild type and mutant EGFR are compared with or without EGF treatment. (D) FACS data comparing EGFR expression level (x-axis) to Tyr 1068 phosphorylation level for wild type EGFR and the 4I mutant.
Figure 6
Figure 6. The Effect of the I640E Mutation on Transmembrane Helix Structure and Receptor Activation (See also Figure S6)
(A) 1H, 15N chemical shift differences between the I640E mutant and the wild type TM-JM segment for each residue. The solid (red) and dashed (black) horizontal lines represent the chemical shift differences expected based on the digital resolution of the spectra and calculated from the average chemical shift, respectively. The vertical red dashed lines represent the predicted membrane-spanning region, based on the sequence analysis. (B) The Ala Cβ region from the 1H-13C (CT) HSQC spectra of the wild type and I640E TM-JM segments in DMPC/DHPC bicelles, respectively. Schematic representation of the C-terminal dimer is shown at the right, with the uniformly labeled helix on the left and unlabeled one on the right. Residues examined in NMR or cell-based experiments are highlighted. (C) Representative 2D strip plot showing the Ala 637 Hβ intermolecular NOE cross peak at the 13C frequency of Ala 637 C , from 3D 15 β N-13C F1-filtered/F3-edited NOESY-HSQC spectra. (D) Surface-density dependence of phosphorylation for the I640E mutation in full-length EGFR. Both wild type and mutant EGFR are compared with or without EGF treatment. (E) FACS data comparing expression level (x-axis) to Tyr 1068 phosphorylation level for the TM-ICM construct, with or without the I640E mutation.
Figure 7
Figure 7. Models for Structural Coupling
(A) Model for structural coupling between the transmembrane helices and the juxtamembrane segments (JM-A) at the plasma membrane, based on NMR data and molecular dynamics simulations (Arkhipov et al.). The LRRLL motif in JM-A is highlighted, with leucine and arginine sidechains in green and blue, respectively. (B) Model for asymmetric dimer formation at the plasma membrane. The surface of the kinase domains and the backbone of the juxtamembrane segments are shown. Residues in the LRRLL motif in the JM-A are shown as sticks, with leucine in yellow (activator) or green (receiver) and arginine in blue. Glu 666 of the receiver and Arg 949 of the activator are also shown.

References

    1. Alvarado D, Klein DE, Lemmon MA. Structural basis for negative cooperativity in growth factor binding to an EGF receptor. Cell. 2010;142:568–579. - PMC - PubMed
    1. Arkhipov A, Shan Y, Das R, Endres NF, Eastwood MP, Wemmer DE, Kuriyan J, Shaw DE. Architecture and membrane interactions of the EGF receptor. Cell. (in press) - PMC - PubMed
    1. Becker W, Bergmann A, Geddes CD, Lakowicz JR. Multi-Dimensional Time-Correlated Single Photon Counting. Vol 2005. Springer; US: 2005.
    1. Bocharov EV, Mineev KS, Volynsky PE, Ermolyuk YS, Tkach EN, Sobol AG, Chupin VV, Kirpichnikov MP, Efremov RG, Arseniev AS. Spatial structure of the dimeric transmembrane domain of the growth factor receptor ErbB2 presumably corresponding to the receptor active state. J Biol Chem. 2008;283:6950–6956. - PubMed
    1. Breeze AL. Isotope-filtered NMR methods for the study of biomolecular structure and interactions. Prog Nucl Mag Res Sp. 2000;36:323–372.

Publication types