

Analysis of HCV quasispecies dynamic under selective pressure of combined therapy
- PMID: 23374983
- PMCID: PMC3598780
- DOI: 10.1186/1471-2334-13-61
Analysis of HCV quasispecies dynamic under selective pressure of combined therapy
Abstract
Background: The quasispecies composition of Hepatitis C virus (HCV) could have important implications with regard to viral persistence and response to interferon-based therapy. The complete NS5A was analyzed to evaluate whether the composition of NS5A quasispecies of HCV 1a/1b is related to responsiveness to combined interferon pegylated (PEG-IFN) and ribavirin therapy.
Methods: Viral RNA was isolated from serum samples collected before, during and after treatment from virological sustained responder (SVR), non-responder (NR) and the end-of-treatment responder patients (ETR). NS5A region was amplified, cloned and sequenced. Six hundred and ninety full-length NS5A sequences were analyzed.
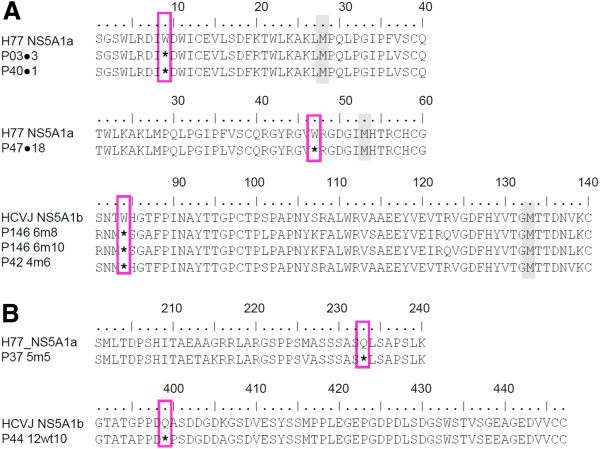
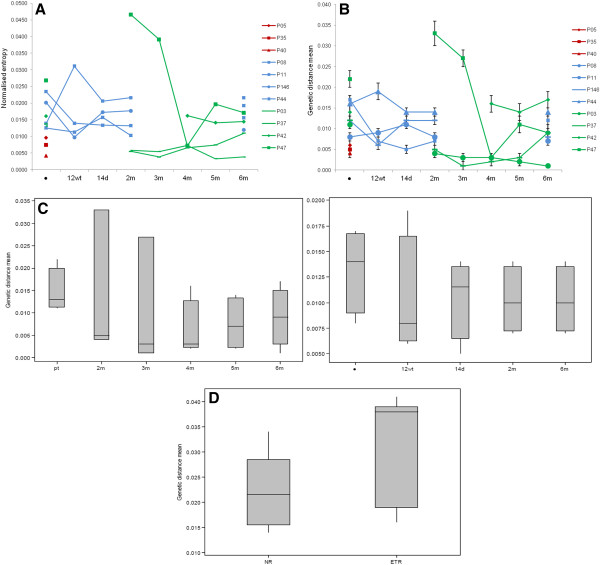
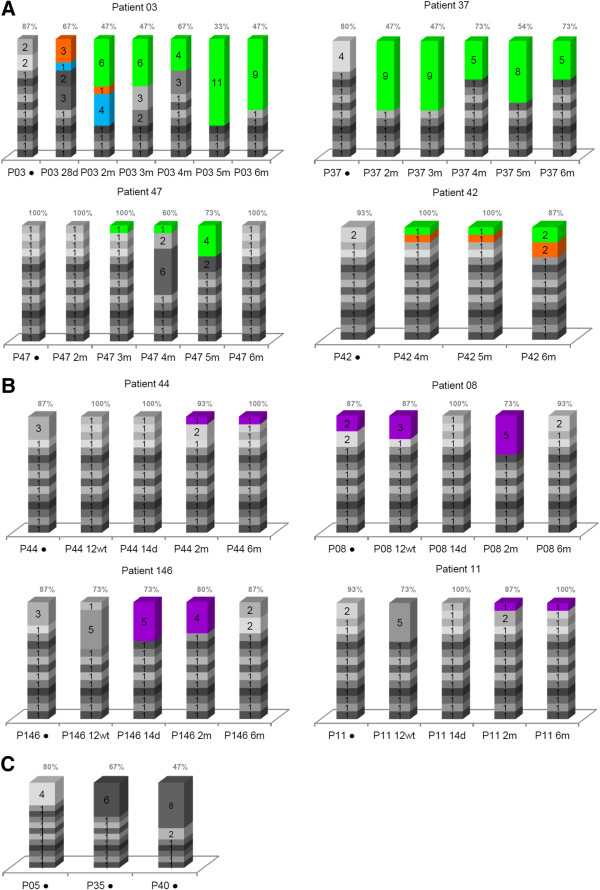
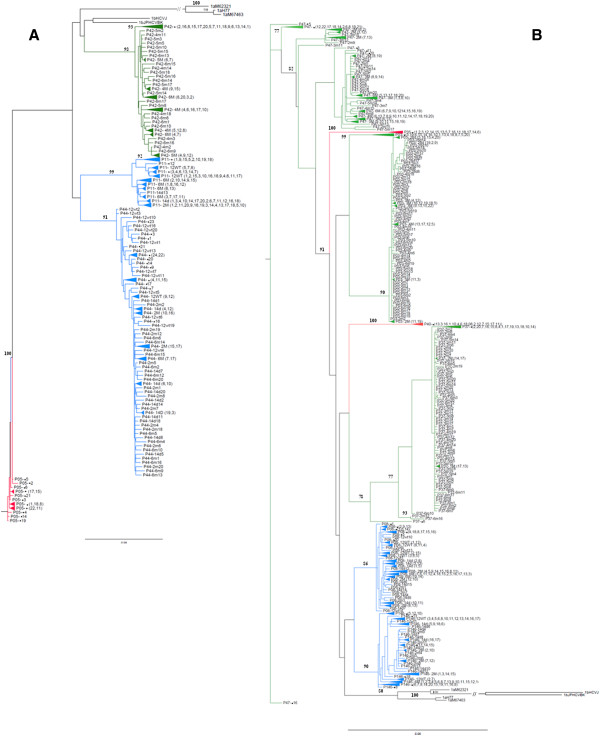
Results: This study provides evidence that lower nucleotide diversity of the NS5A region pre-therapy is associated with viral clearance. Analysis of samples of NRs and the ETRs time points showed that genetic diversity of populations tend to decrease over time. Post-therapy population of ETRs presented higher genetic distance from baseline probably due to the bottleneck phenomenon observed for those patients in the end of treatment. The viral effective population of those patients also showed a strong decrease after therapy. Otherwise, NRs demonstrated a continuous variation or stability of effective populations and genetic diversity over time that did not seem to be related to therapy. Phylogenetic relationships concerning complete NS5A sequences obtained from patients did not demonstrate clustering associated with specific response patterns. However, distinctive clustering of pre/post-therapy sequences was observed. In addition, the evolution of quasispecies over time was subjected to purifying or relaxed purifying selection. Codons 157 (P03), 182 and 440 (P42), 62 and 404 (P44) were found to be under positive selective pressure but it failed to be related to the therapy.
Conclusion: These results confirm the hypothesis that a relationship exists between NS5A heterogeneity and response to therapy in patients infected with chronic hepatitis C.
Figures

Similar articles
-
Interferon resistance of hepatitis C virus genotype 1b: relationship to nonstructural 5A gene quasispecies mutations.J Virol. 1998 Apr;72(4):2795-805. doi: 10.1128/JVI.72.4.2795-2805.1998. J Virol. 1998. PMID: 9525599 Free PMC article.
-
Quasispecies of hepatitis C virus genotype 1 and treatment outcome with peginterferon and ribavirin.Infect Genet Evol. 2009 Jul;9(4):689-98. doi: 10.1016/j.meegid.2008.11.001. Epub 2008 Nov 21. Infect Genet Evol. 2009. PMID: 19063998
-
Genetic diversity of NS5A protein from hepatitis C virus genotype 3a and its relationship to therapy response.BMC Infect Dis. 2010 Feb 23;10:36. doi: 10.1186/1471-2334-10-36. BMC Infect Dis. 2010. PMID: 20178583 Free PMC article.
-
Quasispecies evolution in NS5A region of hepatitis C virus genotype 1b during interferon or combined interferon-ribavirin therapy.World J Gastroenterol. 2007 Feb 28;13(8):1195-203. doi: 10.3748/wjg.v13.i8.1195. World J Gastroenterol. 2007. PMID: 17451199 Free PMC article.
-
Population Disequilibrium as Promoter of Adaptive Explorations in Hepatitis C Virus.Viruses. 2021 Apr 3;13(4):616. doi: 10.3390/v13040616. Viruses. 2021. PMID: 33916702 Free PMC article. Review.
Cited by
-
Flavonoids from Pterogyne nitens Inhibit Hepatitis C Virus Entry.Sci Rep. 2017 Nov 23;7(1):16127. doi: 10.1038/s41598-017-16336-y. Sci Rep. 2017. PMID: 29170411 Free PMC article.
-
Hepatitis C and kidney disease: A narrative review.J Adv Res. 2017 Mar;8(2):113-130. doi: 10.1016/j.jare.2016.07.004. Epub 2016 Jul 26. J Adv Res. 2017. PMID: 28149647 Free PMC article. Review.
-
Copy number variation of genes involved in the hepatitis C virus-human interactome.Sci Rep. 2016 Aug 11;6:31340. doi: 10.1038/srep31340. Sci Rep. 2016. PMID: 27510840 Free PMC article.
-
Analysis of the Enzymatic Activity of an NS3 Helicase Genotype 3a Variant Sequence Obtained from a Relapse Patient.PLoS One. 2015 Dec 10;10(12):e0144638. doi: 10.1371/journal.pone.0144638. eCollection 2015. PLoS One. 2015. PMID: 26658750 Free PMC article.
-
Insights From Deep Sequencing of the HBV Genome-Unique, Tiny, and Misunderstood.Gastroenterology. 2019 Jan;156(2):384-399. doi: 10.1053/j.gastro.2018.07.058. Epub 2018 Sep 27. Gastroenterology. 2019. PMID: 30268787 Free PMC article. Review.
References
-
- GBD. Global burden of disease (GBD) for hepatitis C. J Clin Pharmacol. 2004;44(1):20–29. - PubMed
-
- Manns MP, McHutchison JG, Gordon SC, Rustgi VK, Shiffman M, Reindollar R, Goodman ZD, Koury K, Ling M, Albrecht JK. Peginterferon alfa-2b plus ribavirin compared with interferon alfa-2b plus ribavirin for initial treatment of chronic hepatitis C: a randomised trial. Lancet. 2001;358(9286):958–965. doi: 10.1016/S0140-6736(01)06102-5. - DOI - PubMed
Publication types
MeSH terms
Substances
LinkOut - more resources
Full Text Sources
Other Literature Sources
Molecular Biology Databases
