Comparative Study
. 2013 Feb 4:6:43.
doi: 10.1186/1756-0500-6-43.

Intra-platform comparison of 25-mer and 60-mer oligonucleotide Nimblegen DNA microarrays

Affiliations
Comparative Study

Intra-platform comparison of 25-mer and 60-mer oligonucleotide Nimblegen DNA microarrays

Stephane Fenart et al. BMC Res Notes. .

Abstract

Background: We performed a Nimblegen intra-platform microarray comparison by assessing two categories of flax target probes (short 25-mers oligonucleotides and long 60-mers oligonucleotides) in identical conditions of target production, design, labelling, hybridization, image analyses, and data filtering. We compared technical parameters of array hybridizations, precision and accuracy as well as specific gene expression profiles.

Results: Comparison of the hybridization quality, precision and accuracy of expression measurements, as well as an interpretation of differential gene expression in flax tissues were performed. Both array types yielded reproducible, accurate and comparable data that are coherent for expression measurements and identification of differentially expressed genes. 60-mers arrays gave higher hybridization efficiencies and therefore were more sensitive allowing the detection of a higher number of unigenes involved in the same biological process and/or belonging to the same multigene family.

Conclusion: The two flax arrays provide a good resolution of expressed functions; however the 60-mers arrays are more sensitive and provide a more in-depth coverage of candidate genes potentially involved in different biological processes.


Figures

Figure 1
Figure 1
Boxplots of the distributions of inter-slide hybridization signal intensities and log2 ratios. A: hybridization signal intensities for all experiments in the two array types (I-inner tissues; O-outer tissues); B: expression measurements between each pair-wise combination of inner vs. outer tissues (R1, R2, R3 - replicates 1, 2, 3); C: distribution of the average inter-slides variations measured as the coefficient of variation (CV) or standard deviation (SD) of log2 ratios for 25-mers (25) and 60-mers flax Nimblegen arrays (60). Data from both array types are highly reproducible, nevertheless, the 60-mers arrays presented globally higher signal intensities and lower variation measures compared to 25-mers array type.
Figure 2
Figure 2
The inter-array type’s correlation of expression profiles. Scatter plot was realized using means of log2 ratio of probe intensities in all replicates and shows a strong correlation between the two array types.
Figure 3
Figure 3
Venn diagrams representing the number of targets showing significant differences in expression values between each pair-wise combination of inner vs. outer tissues represented for three different thresholds: -1< log2 ratio >1 (A and B), -2< log2 ratio >2 (C and D) and −3< log2 ratio >3 (E and F). G: unigenes showing significantly opposed expression values on the two arrays.
Figure 4
Figure 4
Correlations of 25-mers and 60-mers array data with sample-matched qRT-PCR data. Standard deviation of qRT-PCR data were represented as bars. Tested genes were: showing A) no significant (1<log2 ratio>−1) expression values on both arrays (C24118, C3323, C21991, C2533), B) significant expression value (log2 ratio>1 or log2 ratio<−1) on one array, but not the other (C57711), C) significant expression values on both arrays (C602, C822) and D) significant but opposed expression values (C50701, C29324). For 5 out of the 9 tested genes, qRT-PCR determined expression values were not significantly different from those determined by both flax arrays. For three other genes, qRT-PCR expression values were significantly different from 25-mers data, but not from 60-mers data. The qRT-PCR expression value of one gene was significantly different from 60-mers data but not from 25-mers data.
Figure 5
Figure 5
Correlations between qRT-PCR and microarray results. Statistically significant correlations were obtained for both 60-mers arrays (r = 0.9832), and 25-mers arrays (r = 0.9414).
Figure 6
Figure 6
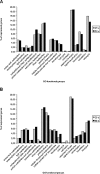
GO functional classification of up-regulated genes (log2 ratio>1) (A) and down-regulated genes (log2 ratio<−1) (B) in inner vs. outer tissues identified by 25- and 60-mers flax Nimblegen arrays.
Figure 7
Figure 7
A: Cluster representing expression profiles of unigenes involved in phenylpropanoid metabolism. First and second columns represent log2 ratio of inner vs. outer tissues in 25- and 60-mers arrays respectively. B: Cluster representing expression profiles of PAL (Phenylalanine Ammonia Lyase) unigenes associated with signal intensities, unigene length and average melting temperartures (Tm) for probes.

References

    1. Bakay M, Chen YW, Borup R, Zhao P, Nagaraju K, Hoffman EP. Sources of variability and effect of experimental approach on expression profiling data interpretation. BMC Bioinformatics. 2002;3:4. doi: 10.1186/1471-2105-3-4. - DOI - PMC - PubMed
    1. Ramdas L, Coombes KR, Baggerly K, Abruzzo L, Highsmith WE, Krogmann T, Hamilton SR, Zhang W. Sources of nonlinearity in cDNA microarray expression measurements. Genome Biol. 2001;2(11):1–7. - PMC - PubMed
    1. Dobbin KK, Kawasaki ES, Petersen DW, Simon RM. Characterizing dye bias in microarray experiments. Bioinformatics. 2005;17:17. - PubMed
    1. Woo Y, Affourtit J, Daigle S, Viale A, Johnson K, Naggert J, Churchill G. A comparison of cDNA, oligonucleotide, and Affymetrix GeneChip gene expression microarray platforms. J Biomol Tech. 2004;5:276–284. - PMC - PubMed
    1. Culhane AC, Perriere G, Higgins DG. Cross-platform comparison and visualisation of gene expression data using co-inertia analysis. BMC Bioinformatics. 2003;4:59. doi: 10.1186/1471-2105-4-59. - DOI - PMC - PubMed

Publication types

Associated data