. 2013 Feb 14;152(4):895-908.
doi: 10.1016/j.cell.2012.12.041. Epub 2013 Jan 31.

A high-resolution enhancer atlas of the developing telencephalon

Affiliations

A high-resolution enhancer atlas of the developing telencephalon

Axel Visel et al. Cell. .

Abstract

The mammalian telencephalon plays critical roles in cognition, motor function, and emotion. Though many of the genes required for its development have been identified, the distant-acting regulatory sequences orchestrating their in vivo expression are mostly unknown. Here, we describe a digital atlas of in vivo enhancers active in subregions of the developing telencephalon. We identified more than 4,600 candidate embryonic forebrain enhancers and studied the in vivo activity of 329 of these sequences in transgenic mouse embryos. We generated serial sets of histological brain sections for 145 reproducible forebrain enhancers, resulting in a publicly accessible web-based data collection comprising more than 32,000 sections. We also used epigenomic analysis of human and mouse cortex tissue to directly compare the genome-wide enhancer architecture in these species. These data provide a primary resource for investigating gene regulatory mechanisms of telencephalon development and enable studies of the role of distant-acting enhancers in neurodevelopmental disorders.


Figures

Figure 1
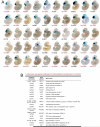
Figure 1. Expression of a subset of forebrain enhancers identified by conservation or p300 binding at whole-mount resolution
A) A selection of 50 reproducible forebrain enhancers at e11.5 identified in this study. In each case, only one of several (minimum: 3) embryos with the same pattern is shown. Additional embryos obtained with each enhancer construct can be viewed at http://enhancer.lbl.gov. Enhancer elements are sorted by broad similarities of patterns as evident at whole-mount resolution. B) Examples of genes implicated in forebrain development that were screened for enhancers in the present study and for which enhancers are shown in A). A full list of all 329 constructs tested in this study, including annotations of enhancer activity patterns and information about neighboring genes are provided in Suppl. Table S4.
Figure 2
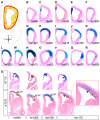
Figure 2. Subset of forebrain enhancers with activity in different dorsoventral subregions of the developing mouse pallium (cortex)
A) Overview of annotated structures in the approximate coronal sectioning plane shown in B)-R). B)-R) Selected enhancers that reproducibly label subregions of the developing pallium. Enhancers are arranged by their spatial specificities in the medial, dorsal, lateral, and ventral pallium. Detailed annotations of all patterns, as well as additional enhancers that drive expression in these subregions are provided in Suppl. Table S5. Full serial sets of sections for each enhancer can be viewed at http://enhancer.lbl.gov, using the enhancer IDs indicated in the figure panels. S) Comparison of enhancer activities between e11.5 and e13.5. Red arrowheads indicate activity in neuronal precursor/differentiation zones, orange arrowheads indicate immature neurons in the cortical plate. Cx, cortex; CxP, cortical plate; DP, dorsal pallium; LGE, lateral ganglionic eminence; LP, lateral pallium; MP, medial pallium; VP, ventral pallium; Se, septum.
Figure 3
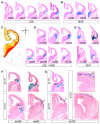
Figure 3. Subset of forebrain enhancers with activity in different subregions of the mouse subpallium (basal ganglia) and eminentia thalami (telencephalic-diencephalic connection)
A), B), D), E) Selected enhancers that target LacZ expression A) predominantly or exclusively to subregions of the LGE, B) predominantly the MGE, D) both the LGE and MGE, and E) the EMT. C) Schematic overview of structures in the approximate sectioning plane shown in A), B), D) and E). Depending on the rostrocaudal extent of staining, for some enhancers more rostral or caudal planes were chosen to illustrate salient features of the respective patterns. F-G) Comparison of enhancer activities between e11.5, e13.5, and e15.5. White arrowheads indicate cell populations whose location is consistent with migration from the MGE, through the LGE, to the cortex. CP, choroid plexus; Cx, cortex; CxP, cortical plate; EMT, eminentia thalami; DP, dorsal pallium; LGE, lateral ganglionic eminence; LP, lateral pallium; MGE, medial ganglionic eminence; MP, medial pallium; MZ, marginal zone; POA, preoptic area; Str, striatum; VP, ventral pallium; Th, thalamus.
Figure 4
Figure 4. Correlation of spatial enhancer activity patterns with RNA expression patterns of nearby genes
A-E) Examples of individual enhancers recapitulating aspects of the gene expression patterns. A) The Arx gene is expressed in subpallial (blue arrows) and pallial (black arrows) regions. Pallial expression increases from e11.5 to e13.5 (insets). At least four enhancers in the extended locus drive subpallial (hs119, hs121) or pallial expression (hs122, hs123) at e11.5. B-E) Additional examples of overlap in enhancer activity with expression of nearby genes in rostral (top) and more caudal (bottom) areas of the telencephalon at e11.5. In all four cases, there was spatial overlap in activity (green arrowheads), as well as gene expression in additional regions that did not show enhancer activity (red arrowheads). F) To assess overall correlations, the annotated activity patterns of telencephalic enhancers were compared to RNA expression patterns of nearby genes. Compared to randomly assigned enhancer:gene pairs, there is a highly significant enrichment of cases in which concordant enhancer activity and gene expression is observed in one or multiple telencephalic subregions (P = 0.0003, Mann-Whitney test). Arx RNA in situ hybridization images in A): Allen Developing Mouse Brain Atlas (http://developingmouse.brain-map.org), reproduced with permission from Allen Institute for Brain Science.
Figure 5
Figure 5. Relating sequence motif content to high-resolution activity annotations
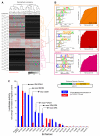
A) Red squares indicate enhancers (rows) active in different telencephalic subregions (columns). Unsupervised clustering (Jaccard’s coefficient, average linkage) of telencephalic subregions by similarity of enhancer activity profiles (top dendrogram) largely follows known developmental, functional and topological relations of telencephalic subregions. Clustering (Euclidean distances, Ward’s method) of enhancers by similarity of observed activity in telencephalic subregions suggests functional subgroups (right dendrogram). Shades of gray indicate the proportion of decision trees assigning each enhancer to the pallium or subpallium class (for pallium and subpallium enhancers) or to the compound pallium/subpallium class (for compound enhancers). B) The Random Forest (RF) classifier distinguishes enhancers that are active in pallium only (top), in both pallium and subpallium (center), and in subpallium only (bottom). Left: Top 5 sequence motifs characterizing each class of enhancers and their relative contribution to the classification. Additional motifs are shown in Suppl. Fig. S2. Right: Receiver-operating characteristic (ROC) curves of predictive performances. The area under the curve (AUC) measures the ability of the classifier to limit incorrect predictions while maintaining accuracy in true predictions. For example, the “pallium and subpallium” classifier correctly identifies ~70% of enhancers in this cluster at a false positive rate of 10%. C) Luciferase co-transfection assays of 20 subpallial enhancers with either the transcription factors Dlx2 or Ascl1 in P19 cells.
Figure 6
Figure 6. Genome-wide experimental comparison of enhancers active during human and mouse cortex development
A) ChIP-seq analysis was performed on human gestational week 20 and mouse postnatal day 0 cortex tissue, using an antibody directed against the enhancer-associated p300/CBP proteins. B) Two representative peaks (candidate enhancers) identified from the human fetal dataset. C) Predicted human fetal cortex enhancers are significantly enriched in the larger vicinity (up to 220kb away) of genes highly expressed in the human fetal cortex. D) The majority of candidate enhancers identified from human fetal cortex show evidence of p300/CBP binding at orthologous sites in the mouse genome (top two sectors of heat map). However, a substantial proportion of human peaks either shows no evidence of p300/CBP binding at orthologous sites in the mouse genome (third sector), or falls into regions of the human genome that have no known orthologous sequence in the mouse (fourth sector). E) A substantially larger proportion of mouse P0 cortex candidate enhancers was found to be bound by p300/CBP at orthologous sites in the human genome. F-K) Transgenic activity analysis of the two candidate enhancers shown in B) in transgenic mice at postnatal day 1. Each pattern was reproducible in a minimum of three F0 animals, three sectioning planes from one representative brain per enhancer are shown. Red arrows indicate expression in the cortex.
Figure 7
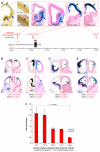
Figure 7. Using telencephalon enhancers as tissue-specific reagents
A) Approach used for generation of the large-scale high-resolution atlas at e11.5. B) Enhancers can be used as drivers of other reporter and effector genes, such as GFP or tamoxifen-inducible Cre recombinase. GFP reporter expression at e11.5 recapitulates the annotated LacZ expression pattern (orange arrowheads). Schematic components of constructs in A) and B) are shown not to scale. C) Stable transgenic lines facilitate temporal profiling of enhancer activity and comparions with corresponding gene expression patterns. D) Tamoxifen induction at e10.5, followed by LacZ staining at a later timepoint (shown: e12.5) can be used for developmental fate mapping of neuronal cell populations.

Comment in

References

    1. Blow MJ, McCulley DJ, Li Z, Zhang T, Akiyama JA, Holt A, Plajzer-Frick I, Shoukry M, Wright C, Chen F, et al. ChIP-Seq identification of weakly conserved heart enhancers. Nat Genet. 2010;42:806–810. - PMC - PubMed
    1. Breiman L. Random Forests. Machine Learning. 2001;45:5–32.
    1. Bryne JC, Valen E, Tang MH, Marstrand T, Winther O, da Piedade I, Krogh A, Lenhard B, Sandelin A. JASPAR, the open access database of transcription factor-binding profiles: new content and tools in the 2008 update. Nucleic Acids Res. 2008;36:D102–106. - PMC - PubMed
    1. Bureau A, Dupuis J, Falls K, Lunetta KL, Hayward B, Keith TP, Van Eerdewegh P. Identifying SNPs predictive of phenotype using random forests. Genet Epidemiol. 2005;28:171–182. - PubMed
    1. Castro DS, Martynoga B, Parras C, Ramesh V, Pacary E, Johnston C, Drechsel D, Lebel-Potter M, Garcia LG, Hunt C, et al. A novel function of the proneural factor Ascl1 in progenitor proliferation identified by genome-wide characterization of its targets. Genes Dev. 2011;25:930–945. - PMC - PubMed

Publication types

Substances

Associated data