

Neuromuscular determinants of maximum walking speed in well-functioning older adults
- PMID: 23376102
- PMCID: PMC3594593
- DOI: 10.1016/j.exger.2013.01.010
Neuromuscular determinants of maximum walking speed in well-functioning older adults
Abstract
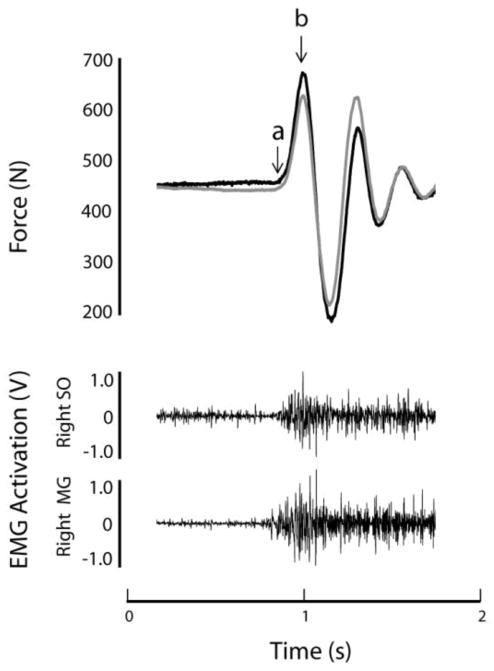
Maximum walking speed may offer an advantage over usual walking speed for clinical assessment of age-related declines in mobility function that are due to neuromuscular impairment. The objective of this study was to determine the extent to which maximum walking speed is affected by neuromuscular function of the lower extremities in older adults. We recruited two groups of healthy, well functioning older adults who differed primarily on maximum walking speed. We hypothesized that individuals with slower maximum walking speed would exhibit reduced lower extremity muscle size and impaired plantarflexion force production and neuromuscular activation during a rapid contraction of the triceps surae muscle group (soleus (SO) and gastrocnemius (MG)). All participants were required to have usual 10-meter walking speed of >1.0m/s. If the difference between usual and maximum 10m walking speed was <0.6m/s, the individual was assigned to the "Slower" group (n=8). If the difference between usual and maximum 10-meter walking speed was >0.6m/s, the individual was assigned to the "Faster" group (n=12). Peak rate of force development (RFD) and rate of neuromuscular activation (rate of EMG rise) of the triceps surae muscle group were assessed during a rapid plantarflexion movement. Muscle cross sectional area of the right triceps surae, quadriceps and hamstrings muscle groups was determined by magnetic resonance imaging. Across participants, the difference between usual and maximal walking speed was predominantly dictated by maximum walking speed (r=.85). We therefore report maximum walking speed (1.76 and 2.17m/s in Slower and Faster, p<.001) rather than the difference between usual and maximal. Plantarflexion RFD was 38% lower (p=.002) in Slower compared to Faster. MG rate of EMG rise was 34% lower (p=.01) in Slower than Faster, but SO rate of EMG rise did not differ between groups (p=.73). Contrary to our hypothesis, muscle CSA was not lower in Slower than Faster for the muscle groups tested, which included triceps surae (p=.44), quadriceps (p=.76) and hamstrings (p=.98). MG rate of EMG rise was positively associated with RFD and maximum 10m walking speed, but not the usual 10m walking speed. These findings support the conclusion that maximum walking speed is limited by impaired neuromuscular force and activation of the triceps surae muscle group. Future research should further evaluate the utility of maximum walking speed for use in clinical assessment to detect and monitor age-related functional decline.
Published by Elsevier Inc.
Figures


Similar articles
-
Does quadriceps neuromuscular activation capability explain walking speed in older men and women?Exp Gerontol. 2014 Jul;55:49-53. doi: 10.1016/j.exger.2014.03.019. Epub 2014 Apr 2. Exp Gerontol. 2014. PMID: 24703887 Free PMC article.
-
Slower Walking Speed in Older Men Improves Triceps Surae Force Generation Ability.Med Sci Sports Exerc. 2017 Jan;49(1):158-166. doi: 10.1249/MSS.0000000000001065. Med Sci Sports Exerc. 2017. PMID: 27471788
-
Achilles Tendon Morphology Is Related to Triceps Surae Muscle Size and Peak Plantarflexion Torques During Walking in Young but Not Older Adults.Front Sports Act Living. 2020 Aug 6;2:88. doi: 10.3389/fspor.2020.00088. eCollection 2020. Front Sports Act Living. 2020. PMID: 33345079 Free PMC article.
-
Contributions to the understanding of gait control.Dan Med J. 2014 Apr;61(4):B4823. Dan Med J. 2014. PMID: 24814597 Review.
-
Human skeletal muscle-specific atrophy with aging: a comprehensive review.J Appl Physiol (1985). 2023 Apr 1;134(4):900-914. doi: 10.1152/japplphysiol.00768.2022. Epub 2023 Feb 24. J Appl Physiol (1985). 2023. PMID: 36825643 Free PMC article. Review.
Cited by
-
Effects of High Intensity Dynamic Resistance Exercise and Whey Protein Supplements on Osteosarcopenia in Older Men with Low Bone and Muscle Mass. Final Results of the Randomized Controlled FrOST Study.Nutrients. 2020 Aug 5;12(8):2341. doi: 10.3390/nu12082341. Nutrients. 2020. PMID: 32764397 Free PMC article. Clinical Trial.
-
Rate of Force Development Is Related to Maximal Force and Sit-to-Stand Performance in Men With Stages 3b and 4 Chronic Kidney Disease.Front Rehabil Sci. 2021 Sep 28;2:734705. doi: 10.3389/fresc.2021.734705. Front Rehabil Sci. 2021. PMID: 34708217 Free PMC article.
-
Effect of calf-raise training on rapid force production and balance ability in elderly men.J Appl Physiol (1985). 2017 Aug 1;123(2):424-433. doi: 10.1152/japplphysiol.00539.2016. Epub 2017 Jun 1. J Appl Physiol (1985). 2017. PMID: 28572499 Free PMC article.
-
Is impaired dopaminergic function associated with mobility capacity in older adults?Geroscience. 2021 Jun;43(3):1383-1404. doi: 10.1007/s11357-020-00303-z. Epub 2020 Nov 24. Geroscience. 2021. PMID: 33236263 Free PMC article.
-
Exploring motor unit and neuromuscular junction dysfunction in aging and sarcopenia: insights from electromyography in systematic review.Geroscience. 2025 Jul 8. doi: 10.1007/s11357-025-01760-0. Online ahead of print. Geroscience. 2025. PMID: 40627125 Review.
References
-
- Aagaard P, Simonsen EB, Andersen JL, Magnusson P, Dyhre-Poulsen P. Increased rate of force development and neural drive of human skeletal muscle following resistance training. J Appl Physiol. 2002;93:1318–1326. - PubMed
-
- Abellan van Kan G, Rolland Y, Andrieu S, Bauer J, Beauchet O, Bonnefoy M, Cesari M, Donini LM, Gillette Guyonnet S, Inzitari M, Nourhashemi F, Onder G, Ritz P, Salva A, Visser M, Vellas B. Gait speed at usual pace as a predictor of adverse outcomes in community-dwelling older people an International Academy on Nutrition and Aging (IANA) Task Force. J Nutr Health Aging. 2009;13:881–889. - PubMed
-
- Brach JS, Kriska AM, Newman AB, VanSwearingen JM. A new approach of measuring muscle impairment during a functional task: quadriceps muscle activity recorded during chair stand. J Gerontol A Biol Sci Med Sci. 2001;56:M767–770. - PubMed
-
- Burden A. How should we normalize electromyograms obtained from healthy participants? What we have learned from over 25 years of research. J Electromyogr Kinesiol. 2010;20:1023–1035. - PubMed
-
- Cesari M, Kritchevsky SB, Penninx BW, Nicklas BJ, Simonsick EM, Newman AB, Tylavsky FA, Brach JS, Satterfield S, Bauer DC, Visser M, Rubin SM, Harris TB, Pahor M. Prognostic value of usual gait speed in well-functioning older people--results from the Health, Aging and Body Composition Study. J Am Geriatr Soc. 2005;53:1675–1680. - PubMed
Publication types
MeSH terms
Grants and funding
LinkOut - more resources
Full Text Sources
Other Literature Sources
Medical
