. 2013 May;9(5):6381-92.
doi: 10.1016/j.actbio.2013.01.026. Epub 2013 Feb 1.

Three-dimensional hMSC motility within peptide-functionalized PEG-based hydrogels of varying adhesivity and crosslinking density

Affiliations

Three-dimensional hMSC motility within peptide-functionalized PEG-based hydrogels of varying adhesivity and crosslinking density

Kyle A Kyburz et al. Acta Biomater. 2013 May.

Abstract

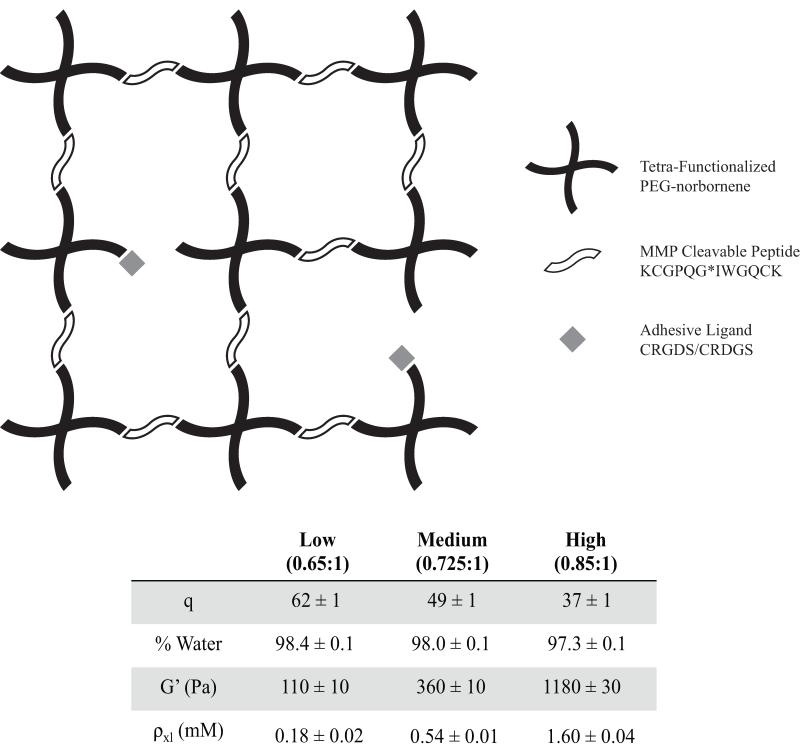
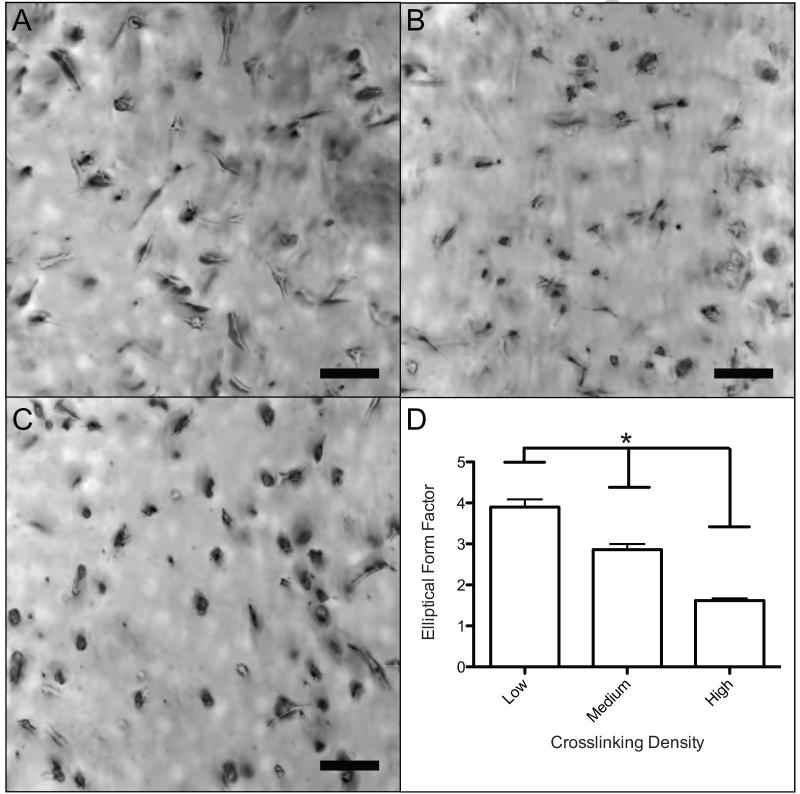
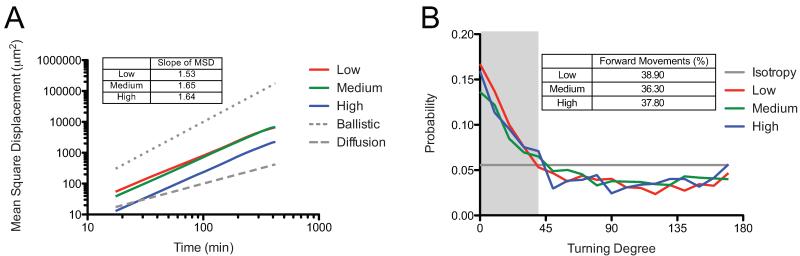
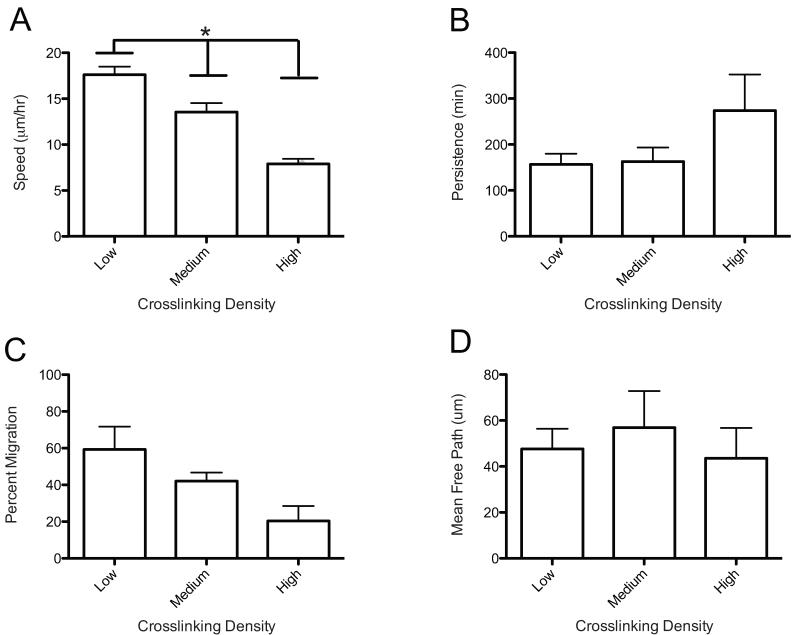
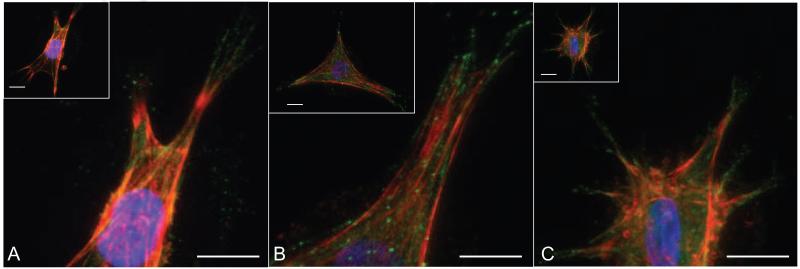
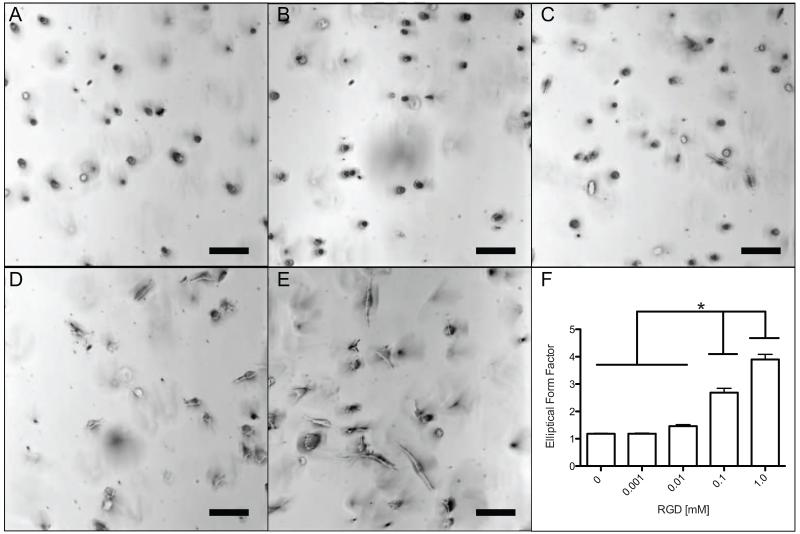
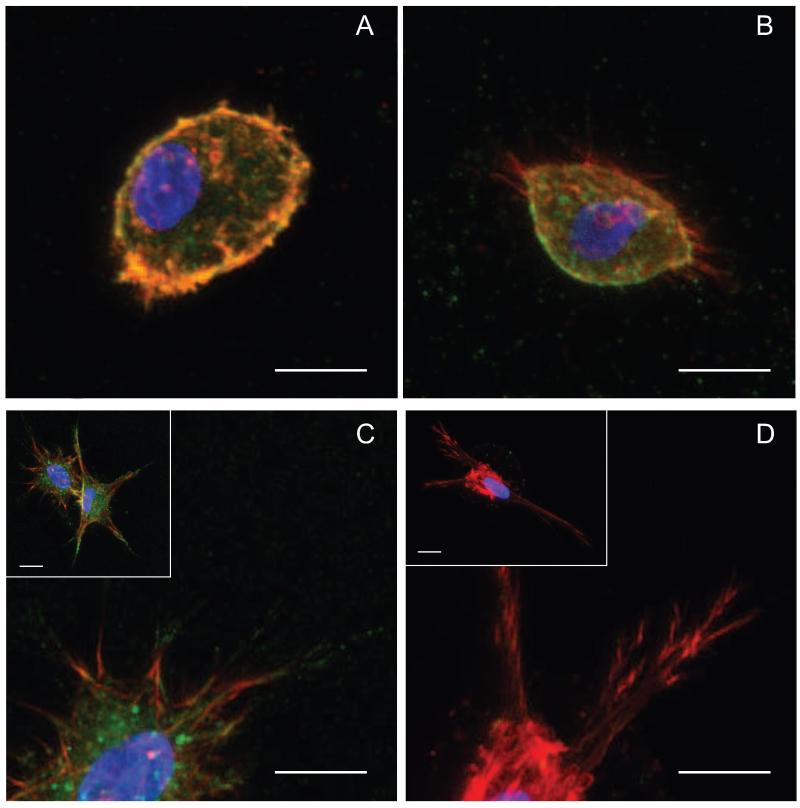
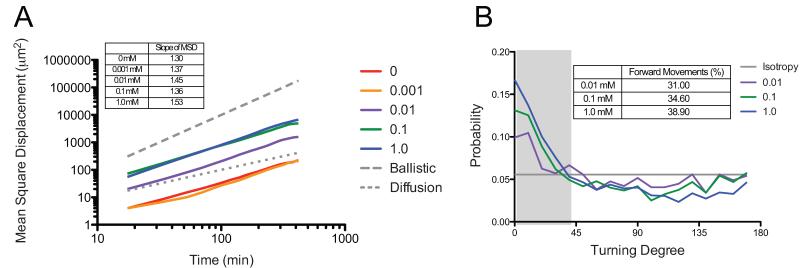
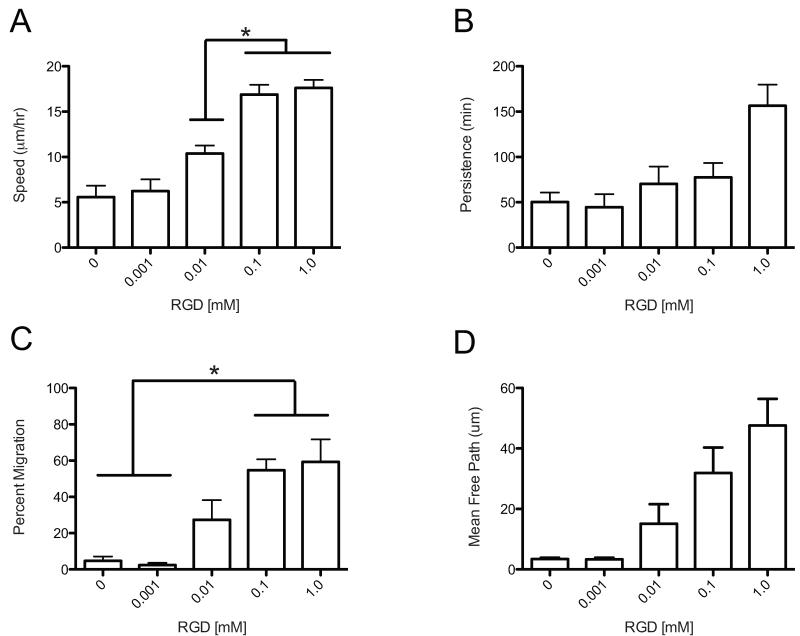
Human mesenchymal stem cell (hMSC) migration and recruitment play a critical role during bone fracture healing. Within the complex three-dimensional (3-D) in vivo microenvironment, hMSC migration is regulated through a myriad of extracellular cues. Here, we use a thiol-ene photopolymerized hydrogel to recapitulate structural and bioactive inputs in a tunable manner to understand their role in regulating 3-D hMSC migration. Specifically, peptide-functionalized poly(ethylene glycol) hydrogels were used to encapsulate hMSC while varying the crosslinking density, from 0.18±0.02 to 1.60±0.04 mM, and the adhesive ligand density, from 0.001 to 1.0 mM. Using live-cell videomicroscopy, migratory cell paths were tracked and fitted to a Persistent Random Walk model. It was shown that hMSC migrating through the lowest crosslinking density and highest adhesivity had more sustained polarization, higher migrating speeds (17.6±0.9 μm h(-1)) and higher cell spreading (elliptical form factor=3.9±0.2). However, manipulation of these material properties did not significantly affect migration persistence. Further, there was a monotonic increase in cell speed and spreading with increasing adhesivity that showed a lack of the biphasic trend seen in 2-D cell migration. Immunohistochemistry showed well-formed actin fibers and β1 integrin staining at the ends of stress fibers. This thiol-ene platform provides a highly tunable substrate to characterize 3-D hMSC migration that can be applied as an implantable cell carrier platform or for the recruitment of endogenous hMSC in vivo.


Figures

Figure 1
Figure 1
Thiol-ene photopolymerization of a tetra-functionalized PEG-norbornene, MMP cleavable peptide (KCGPQG↓IWGQCK), and adhesive ligands (CRGDS, CRDGS) occurs through a radically mediated step growth reaction to encapsulate hMSC within a 3D tunable microenvironment. The table presents mass swelling ratio (q), % water, shear modulus (G’), and crosslinking density (ρxl, calculated from Rubber Elasticity Theory) while the thiol:ene ratio was varied to produce Low, Medium, and High gels. As thiol:ene ratio increases, mass swelling decreases, % water slightly decreases, and shear modulus and crosslinking density increase.
Figure 2
Figure 2
Morphology of encapsulated hMSCs cultured for 30 hours in gel systems with varying crosslinking density. A) Brightfield image (10× magnification) of hMSCs in a Low (65%) gel. Cells were found to be well spread and linear. B) Brightfield image (10× magnification) of hMSCs in a Medium (72.5%) gel. Cells were found spread with many protrusions. C) Brightfield image (10× magnification) of hMSCs in a High (85%) gel. Cells were rounded with little or no protrusions. D) An elliptical form factor was calculated by dividing the length and perpendicular width of each cell. There is a significant (*p < 0.05) decreasing trend found from a one-way ANOVA and Tukey’s Test. Scale bar represents 100 μm.
Figure 3
Figure 3
hMSC migration was followed over 7 hours using live cell videomicroscopy. Effect of varying crosslinking density on hMSC mean square displacement and sustained cell polarity was calculated from the cell tracks measured using Metamorph. (A) Mean-square displacement was similar for Low and Medium gels, but differed for cells in High crosslinked gels. All three gels had slopes that fell between 1 (random migration) and 2 (ballistic migration) (B) Sustained cell polarity showed a similar bias for all three systems, and a similar percentage of sustained steps.
Figure 4
Figure 4
Cell tracks from hMSC migration in 3D are modeled using a Persistent Random Walk model (PRW). Effect of varying crosslinking density on hMSC migration. (A) Cell speed shows a decreasing trend with increasing crosslink density. (*Significance P< 0.05) (B) Persistence shows no statistical difference over the varying crosslink densities. (C) Percent migration shows a decreasing although not statistically significant difference. (D) Mean free path was not affected by varying the crosslinking density.
Figure 5
Figure 5
Encapsulated hMSCs were cultured in gels at the three different crosslinking densities for 48 hours and immunostained for actin (red), β1 integrin (green) and DAPI (blue). A) Low Crosslinking B) Medium Crosslinking C) High Crosslinking. Spread hMSC in all three gels systems show actin fiber formation and punctate β1 integrin at the ends of these fibers over this range of crosslinking densities. Scale bars represent 50 μm.
Figure 6
Figure 6
Morphology of encapsulated hMSCs cultured for 30 hours in gel systems with varying CRGDS. A) Brightfield image (10× magnification) of hMSCs in 0 mM CRGDS gel. Cells were rounded. B) Brightfield image (10× magnification) of hMSCs in 0.001 mM CRGDS gel. Cells were rounded. C) Brightfield image (10× magnification) of hMSCs in 0.01 mM gels. Cells were rounded with little or no protrusions. D) Brightfield image (10× magnification) of hMSCs in 0.1 mM CRGDS gel. Cells were spread and linear. E) Brightfield image (10× magnification) of hMSCs in 1.0 mM CRGDS gel. Cells were more spread and linear. F) An elliptical form factor was calculated by dividing the length and perpendicular width of each cell. There is a significant (*p < 0.05) increasing trend found from a one-way ANOVA and Tukey’s Test between the first three systems with the 0.1 mM and 1.0 mM systems. Scale bar represents 100 μm.
Figure 7
Figure 7
Encapsulated hMSCs were cultured in gels with varying CRGDS concentration for 48 hours and immunostained for actin (red), β1 integrin (green) and DAPI (blue). A) For 0.001 mM gels, cells remain rounded and show little if any β1 integrin even on the rounded edges of the cell B) For 0.01 mM gels, actin protrusions are present although limited with few β1 integrin staining on actin fibers C) For 0.1 mM gels, cells are spread with large, protrusive actin fiber formation with β1 integrin staining on protrusions. D) For 1.0 mM gels, cells are similar to the 0.1 mM cells with protrusive actin fibers however, the β1 integrin staining seems more localized to the ends of actin fibers. Scale bar represents 50 μm.
Figure 8
Figure 8
hMSC migration was followed over 7 hours using live cell videomicroscopy. The effect of varying CRGDS concentration on hMSC mean square displacement and sustained cell polarity was calculated from the cell tracks measured using Metamorph. A) Mean-square displacement was similar for 1.0 mM and 0.1 mM gels, and 0 mM and 0.001 mM gels were also similar. All five gels had slopes that fell between 1 (random migration) and 2 (ballistic migration) B) Sustained cell polarity showed a similar bias for all three systems, and a similar percentage of sustained steps.
Figure 9
Figure 9
Cell tracks from hMSC migration in 3D are modeled using a Persistent Random Walk model (PRW). Effect of varying CRGDS concentration on hMSC migration was studied. A) Cell speed shows an increasing trend with increasing CRGDS concentration.(*Significance P< 0.05) B) Persistence shows no statistical difference over the varying CRGDS C) Percent migration shows an increasing trend with increasing CRGDS concentration that plateaus for 0.1 mM and 1.0 mM gels. (*Significance P< 0.05) D) Mean free path was not affected by varying the CRGDS concentration.

References

    1. Uccelli A, Moretta L, Pistoia V. Mesenchymal stem cells in health and disease. Nature Reviews Immunology. 2008;8:726–36. - PubMed
    1. Salem HK, Thiemermann C. Mesenchymal Stromal Cells: Current Understanding and Clinical Status. Stem Cells. 2010;28:585–96. - PMC - PubMed
    1. Discher DE, Mooney DJ, Zandstra PW. Growth Factors, Matrices, and Forces Combine and Control Stem Cells. Science. 2009;324:1673–7. - PMC - PubMed
    1. Chen F-M, Wu L-A, Zhang M, Zhang R, Sun H-H. Homing of endogenous stem/progenitor cells for in situ tissue regeneration: Promises, strategies, and translational perspectives. Biomaterials. 2011;32:3189–209. - PubMed
    1. Friedl P, Wolf K. Plasticity of cell migration: a multiscale tuning model. J Cell Biol. 2010;188:11–9. - PMC - PubMed

Publication types