A novel statistical approach shows evidence for multi-system physiological dysregulation during aging
- PMID: 23376244
- PMCID: PMC3971434
- DOI: 10.1016/j.mad.2013.01.004
A novel statistical approach shows evidence for multi-system physiological dysregulation during aging
Abstract
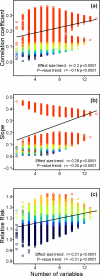
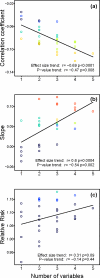
Previous studies have identified many biomarkers that are associated with aging and related outcomes, but the relevance of these markers for underlying processes and their relationship to hypothesized systemic dysregulation is not clear. We address this gap by presenting a novel method for measuring dysregulation via the joint distribution of multiple biomarkers and assessing associations of dysregulation with age and mortality. Using longitudinal data from the Women's Health and Aging Study, we selected a 14-marker subset from 63 blood measures: those that diverged from the baseline population mean with age. For the 14 markers and all combinatorial sub-subsets we calculated a multivariate distance called the Mahalanobis distance (MHBD) for all observations, indicating how "strange" each individual's biomarker profile was relative to the baseline population mean. In most models, MHBD correlated positively with age, MHBD increased within individuals over time, and higher MHBD predicted higher risk of subsequent mortality. Predictive power increased as more variables were incorporated into the calculation of MHBD. Biomarkers from multiple systems were implicated. These results support hypotheses of simultaneous dysregulation in multiple systems and confirm the need for longitudinal, multivariate approaches to understanding biomarkers in aging.
Copyright © 2013 Elsevier Ireland Ltd. All rights reserved.
Figures


References
-
- Ble A, Fink JC, Woodman RC, Klausner MA, Windham BG, Guralnik JM, Ferrucci L. Renal Function, Erythropoietin, and Anemia of Older Persons: The InCHIANTI Study. Arch Intern Med. 2005;165:2222–2227. - PubMed
-
- Bouezmarni T, Rombouts JVK. Nonparametric density estimation for multivariate bounded data. Journal of Statistical Planning and Inference. 2010;140:139–152.
-
- Bulpitt CJ, Antikainen RL, Markowe HL, Shipley MJ. Mortality according to a prior assessment of biological age. Current Aging Science. 2009;2:193–199. - PubMed
-
- Cohen AA, Martin LB, Wingfield JC, McWilliams SR, Dunne JA. Physiological regulatory networks: ecological roles and evolutionary constraints. Trends in Ecology & Evolution. 2012;27:428–435. - PubMed
Publication types
MeSH terms
Substances
Grants and funding
LinkOut - more resources
Full Text Sources
Other Literature Sources
Medical
Miscellaneous

