Comparative Study
. 2013 May;144(5):1066-1075.e1.
doi: 10.1053/j.gastro.2013.01.054. Epub 2013 Jan 31.

Integrated metabolite and gene expression profiles identify lipid biomarkers associated with progression of hepatocellular carcinoma and patient outcomes

Affiliations
Comparative Study

Integrated metabolite and gene expression profiles identify lipid biomarkers associated with progression of hepatocellular carcinoma and patient outcomes

Anuradha Budhu et al. Gastroenterology. 2013 May.

Abstract

Background & aims: We combined gene expression and metabolic profiling analyses to identify factors associated with outcomes of patients with hepatocellular carcinoma (HCC).

Methods: We compared metabolic and gene expression patterns between paired tumor and nontumor tissues from 30 patients with HCC, and validated the results using samples from 356 patients with HCC. A total of 469 metabolites were measured using liquid chromatography/mass spectrometry and gas chromatography/mass spectrometry. Metabolic and genomic data were integrated, and Kaplan-Meier and Cox proportional hazards analyses were used to associate specific patterns with patient outcomes. Associated factors were evaluated for their effects on cancer cells in vitro and tumor formation in nude mice.

Results: We identified 28 metabolites and 169 genes associated with aggressive HCC. Lipid metabolites of stearoyl-CoA-desaturase (SCD) activity were associated with aberrant palmitate signaling in aggressive HCC samples. Expression of gene products associated with these metabolites, including SCD, were associated independently with survival times and tumor recurrence in the test and validation sets. Combined expression of SCD and α-fetoprotein were associated with outcomes of patients with early-stage HCC. Levels of monounsaturated palmitic acid, the product of SCD activity, were increased in aggressive HCCs; monounsaturated palmitic acid increased migration and invasion of cultured HCC cells and colony formation by HCC cells. HCC cells that expressed small interfering RNA against SCD had decreased cell migration and colony formation in culture and reduced tumorigenicity in mice.

Conclusions: By using a combination of gene expression and metabolic profile analysis, we identified a lipogenic network that involves SCD and palmitate signaling and was associated with HCC progression and patient outcomes. The microarray platform and data have been submitted to the Gene Expression Omnibus public database at NCBI following MIAME guidelines. Accession numbers: GPL4700 (platform), and GSE6857 (samples).


Figures

FIGURE 1
FIGURE 1. Significant differentially expressed metabolites associated with HCC tumors and subtypes
A, Principal components analysis of all metabolites (n=469) measured in biospecimens is shown comparing tumor (red) versus nontumor (blue) tissues. Each axes represents one of three principal components. B, A S-plot of the normalized metabolite expression (tumor vs nontumor) in log2 scale of the 28 tumor, subtype and survival-related metabolites is shown. Each point represents one metabolite in one sample, colored by tissue type (HpSC: orange; MH: blue). Metabolites with a Y prefix are currently unknown.
FIGURE 2
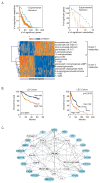
FIGURE 2. Gene surrogates of the 28-metabolite signature are associated with survival and the PI3K network
A, upper left panel: A plot of the correlation between the 28 metabolites with 169 genes is shown. The orange curve represents the plot of correlation between the 28 metabolites and 169 randomly chosen genes. Upper right panel: A plot of the correlation between the 15 metabolites with 169 genes. The orange curve represents the plot of correlation between the 169 genes and 15 randomly chosen metabolites. For both upper panels, the experimental data is shown in the blue curve. The standard deviation is shown for the randomization analysis. The red-dashed line represents the point of largest difference between the experimental and randomized data. lower panel: Hierarchical clustering of 15 metabolites and 169 genes whose expression was significantly (p<0.05) altered in tumor tissues of HpSC HCC. Each row represents an individual metabolite and each column represents an individual gene. Genes were ordered by centered correlation and complete linkage according to their correlation coefficient. Pseudocolors indicate positive (orange) or negative (blue) correlation values or missing values (grey), respectively. The scale represents the correlation values from 1 to −1 in log 2 scale. Metabolites with a Y prefix are currently unknown. B, left panel: Survival risk prediction of the 217 test cases of the LCI cohort was performed using BRB ArrayTools restricted to the 273 geneset with 2 risk groups (high vs low), 2 principal components, and 1000 permutations of the significance of the log rank test. A Kaplan-Meier overall survival analysis curve is shown for high and low risk survival groups with the log rank p value. right panel: Survival Risk Prediction of 139 cases of the LEC validation cohort was performed using BRB ArrayTools restricted to the 273 geneset with 2 risk groups (high vs low), 2 principal components, and 1000 permutations of the significance of the log rank test. A Kaplan-Meier overall survival analysis curve is shown for high and low risk survival groups with the log rank p value. C, The PI3K network is altered in HpSC HCC. The blue colored genes represent those genes among the 273 gene surrogates that were imported to Ingenuity Pathway Analysis.
FIGURE 3
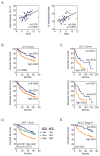
FIGURE 3. SCD expression is associated with fatty-acid metabolites and with patient outcome
A, Correlation analysis of SCD and palmitoleate or 15-methylpalmitate is shown. The Spearman r value and p-value are presented. B, A Kaplan-Meier overall survival analysis curve (upper panel) or disease-free analysis curve (lower panel) is shown for high and low risk survival groups among the LCI cohort with the log rank p value based on SCD categorized as high or low according to its median expression among tumor specimens. C, A Kaplan-Meier overall survival analysis curve (upper panel) or disease-free analysis curve (lower panel) is shown for high and low risk survival groups among the LEC cohort with the log rank p value based on SCD categorized as high or low according to its median expression among tumor specimens. D, Kaplan-Meier curves show overall survival of the LCI cohort subgrouped by SCD and AFP. Disc: discordant risk assessments; high SCD expression and low risk predicted by AFP (<300 ng/mL) or vice-versa. E, Kaplan-Meier curves show overall survival of BCLC Stage A patients among the LCI cohort subgrouped by SCD.
FIGURE 4
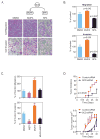
FIGURE 4. Abrogation of SCD reduces cell migration, invasion, colony formation and tumor formation
A, Huh7 cells were treated with 100uM SPA or 100uM MUPA for 3 days, incubated for 22 hrs in boyden chambers and those migrating and invading were quantified. Representative images are shown on the left. A model depicting SPA conversion to MUPA by SCD is shown at the top left panel. B, Corresponding quantitation of Huh7 migration and invasion data is presented as the mean ±SD of triplicate experiments with p-value relative to DMSO. C, Huh7 cells were treated with metformin (10mM) for 2 days or 100uM MUPA for 3 days or in combination, incubated for 22 hrs in boyden chambers followed by quantitation of migration and invasion. Data is presented as the mean ±SD of triplicate experiments with p-value (METf (metformin) or MUPA vs. DMSO or metformin vs MUPA+Metformin). D, Tumor incidence of Huh7 cells transfected with SCD siRNA or control siRNA after subcutaneous injection into both flanks of immunocompromised mice (n=5). Percent tumor incidence is shown with the log-rank p-value (upper panel). Growth curve of tumor xenografts of Huh7 cells transfected with SCD siRNA or control siRNA is shown in the lower panel. Data represent averages ± standard error of the mean. *P<0.05 or ** p<0.001 by 2-sided Student’s t-test.

References

    1. Sreekumar A, Poisson LM, Rajendiran TM, et al. Metabolomic profiles delineate potential role for sarcosine in prostate cancer progression. Nature. 2009;457:910–914. - PMC - PubMed
    1. Akavia UD, Litvin O, Kim J, et al. An integrated approach to uncover drivers of cancer. Cell. 2010;143:1005–1017. - PMC - PubMed
    1. Nielsen J, Oliver S. The next wave in metabolome analysis. Trends Biotechnol. 2005;23:544–546. - PubMed
    1. Heinemann M, Zenobi R. Single cell metabolomics. Curr Opin Biotechnol. 2011;22:26–31. - PubMed
    1. Budhu A, Forgues M, Ye QH, et al. Prediction of venous metastases, recurrence and prognosis in hepatocellular carcinoma based on a unique immune response signature of the liver microenvironment. Cancer Cell. 2006;10:99–111. - PubMed

Publication types

MeSH terms

Substances

Associated data