Comparative Study
. 2013 May;144(5):1055-65.
doi: 10.1053/j.gastro.2013.01.053. Epub 2013 Jan 30.

Akt and mTORC1 have different roles during liver tumorigenesis in mice

Affiliations
Comparative Study

Akt and mTORC1 have different roles during liver tumorigenesis in mice

Heidi L Kenerson et al. Gastroenterology. 2013 May.

Abstract

Background & aims: Phosphatidylinositide 3-kinase (PI3K) is deregulated in many human tumor types, including primary liver malignancies. The kinase v-akt murine thymoma viral oncogene homolog 1 (Akt) and mammalian target of rapamycin complex (mTORC1) are effectors of PI3K that promote cell growth and survival, but their individual roles in tumorigenesis are not well defined.

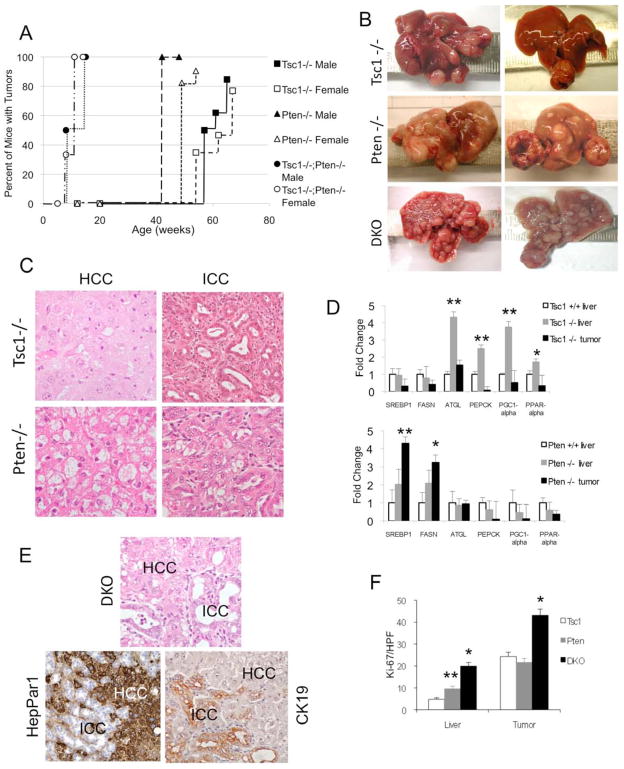
Methods: In livers of albumin (Alb)-Cre mice, we selectively deleted tuberous sclerosis (Tsc)1, a negative regulator of Ras homolog enriched in brain and mTORC1, along with Phosphatase and tensin homolog (Pten), a negative regulator of PI3K. Tumor tissues were characterized by histologic and biochemical analyses.

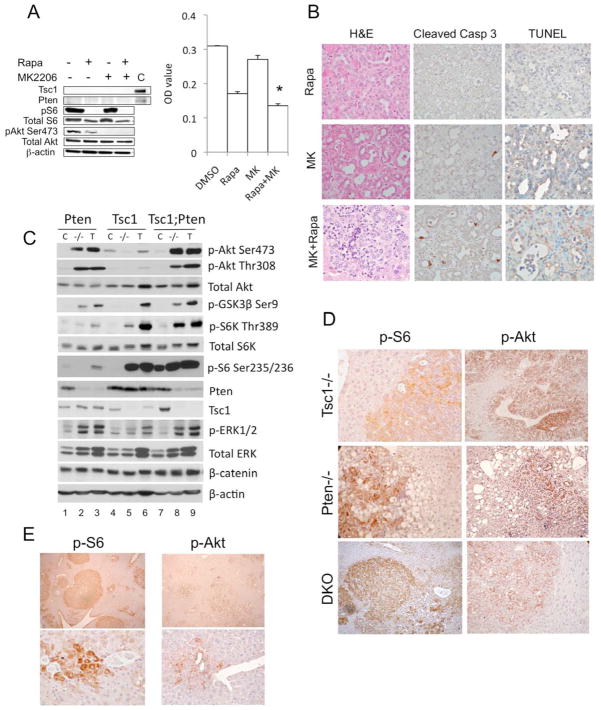
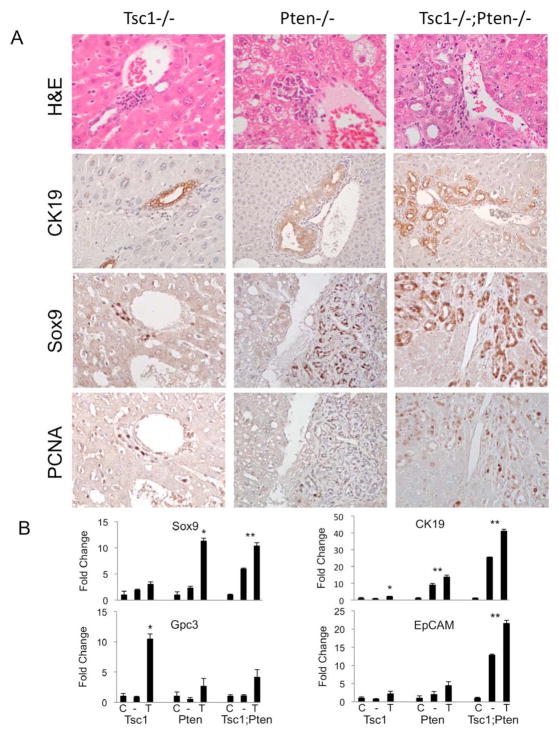
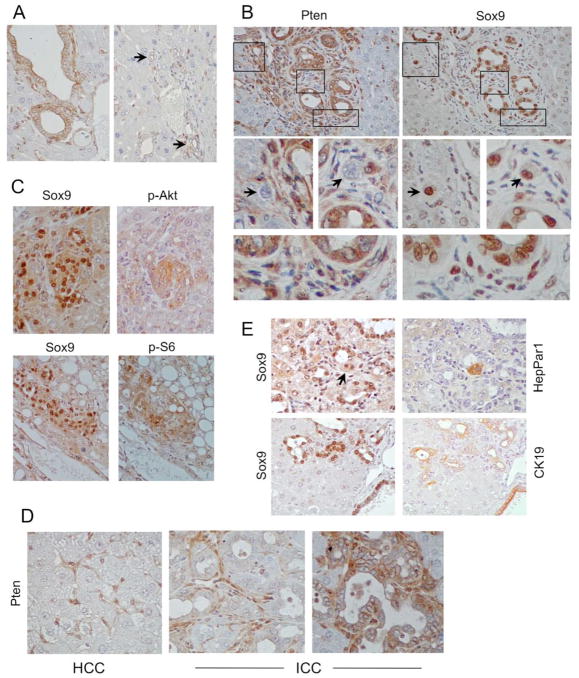
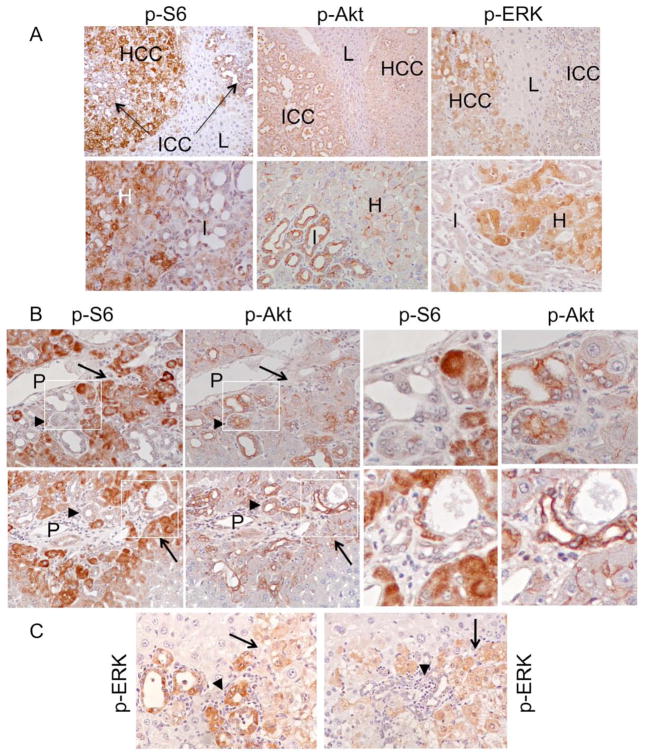
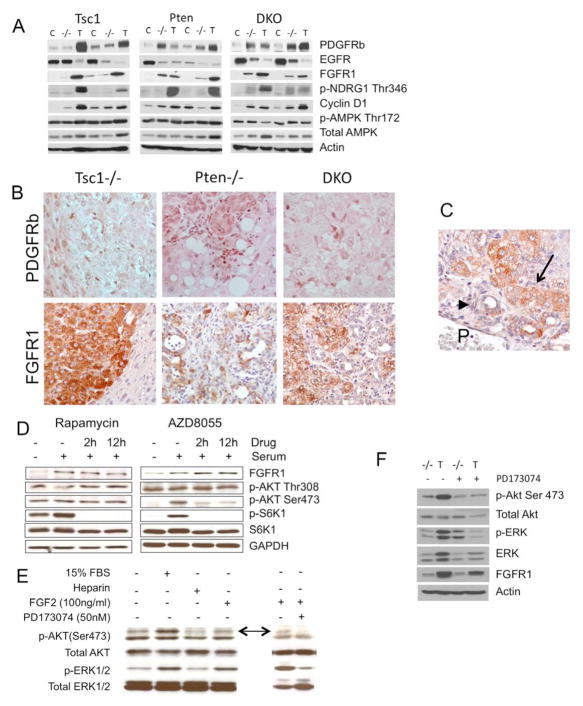
Results: The Tsc1fl/fl;AlbCre, Ptenfl/fl;AlbCre, and Tsc1fl/fl;Ptenfl/fl;AlbCre mice developed liver tumors that differed in size, number, and histologic features. Livers of Tsc1fl/fl;AlbCre mice did not develop steatosis; tumors arose later than in the other strains of mice and were predominantly hepatocellular carcinomas. Livers of the Ptenfl/fl;AlbCre mice developed steatosis and most of the tumors that formed were intrahepatic cholangiocarcinomas. Livers of Tsc1fl/fl;Ptenfl/fl;AlbCre formed large numbers of tumors, of mixed histologies, with the earliest onset of any strain, indicating that loss of Tsc1 and Pten have synergistic effects on tumorigenesis. In these mice, the combination of rapamycin and MK2206 was more effective in reducing liver cell proliferation and inducing cell death than either reagent alone. Tumor differentiation correlated with Akt and mTORC1 activities; the ratio of Akt:mTORC1 activity was high throughout the course of intrahepatic cholangiocarcinomas development and low during hepatocellular carcinoma development. Compared with surrounding nontumor liver tissue, tumors from all 3 strains had increased activities of Akt, mTORC1, and mitogen-activated protein kinase and overexpressed fibroblast growth factor receptor 1. Inhibition of fibroblast growth factor receptor 1 in Tsc1-null mice suppressed Akt and mitogen-activated protein kinase activities in tumor cells.

Conclusions: Based on analyses of knockout mice, mTORC1 and Akt have different yet synergistic effects during the development of liver tumors in mice.


Figures

Figure 1
Figure 1
HCC and ICC in Tsc1−/−, Pten−/− and DKO livers. A) Incidence of liver tumors in each of the three models: Tsc1−/−, Pten−/− and Tsc1−/−;Pten−/− (DKO) mice stratified by sex. Cre-negative control mice did not develop liver tumors over the same time period (data not shown). B) Gross appearances of 64-wk Tsc1−/−, 52-wk Pten−/−, and 14-wk DKO livers. C) Representative H&E photomicrographs of HCC (left column) and ICC (right column) in Tsc1−/− and Pten−/− livers. Note ballooning and lipid accumulation in the Pten−/− HCC. Magnification: 400X. D) qRT-PCR analyses comparing the expression of metabolic genes in tumor, non-tumor livers and Cre–negative control (Tsc1+/+) livers. * p<0.05; ** p<0.01 compared to control. E) Histologic appearance of a mixed HCC-ICC in a DKO liver. HepPar1 immunoreactivity highlights HCC, and CK-19 highlights ICC. Magnification: 400X. F) Proliferation of non-tumor livers and tumors in each of the 3 models as determined by the number of Ki67-‘positive’ cells per high power field. Data obtained from 3 mice/group with 5 HPFs each. * p<0.01 compared to Tsc1−/− and Pten−/−; ** p<0.05 compared to Tsc1−/−.
Figure 2
Figure 2
Synergistic effects of Tsc1 and Pten deletion on tumor development. A) Effects of rapamycin (50nM) and MK2206 (500nM) on the proliferation of primary DKO tumor cells. After a three-day treatment, MTT assay was performed in triplicates and O.D. was measured. Immunoblot shows the intended effects of the inhibitors. C, control. * p<0.05 compared to Rapa, p=0.0001 compared to DMSO and MK. B) In vivo effects of rapamycin (2mg/kg, ip, q2d), MK2206 (300mg/kg, po, q2d) or both after one week of treatment. Representative tumors processed by H&E, cleaved caspase 3 and TUNEL staining. Magnification 400x. C) Immunoblot analyses of livers (−/−) and tumors (T) from the 3 models compared to respective Cre-negative controls (C). D) IHC analyses highlighting phospho-S6 and phospho-Akt expression in tumors of the 3 models. E) Multi-focal tumors in DKO livers highlighted by phospho-S6 and phospho-Akt expression. Bottom: early peri-ductal tumors. Magnification: 40x (top), 400x (bottom).
Figure 3
Figure 3
Loss of Tsc1 and/or Pten is accompanied by an expansion of peri-portal progenitor cells. A) H&E staining shows variable accumulation of peri-ductal/portal cells in the 3 models (Top panels). CK19 expression is largely confined to the biliary epithelial cells. Sox9 and PCNA expression in the periportal regions are shown in serial histologic sections. Original magnification: 400X except for CK19 in Pten−/− and Tsc1−/−;Pten−/− (200X). B) mRNA expression of progenitor markers using qRT-PCR analyses of tissue samples from Cre-negative control livers (C), mutant livers (−), and tumors (T) in each of the 3 models. * p<0.05 comparing tumor (T) with non-tumor liver (−) and control liver (C). **p<0.05 comparing control liver (C) with non-tumor liver (−) and tumor (T).
Figure 4
Figure 4
Sox9-expressing cells in DKO livers. A) IHC analyses of DKO non-tumor livers showing variable Pten expression in cholangiocytes. Arrows indicate small peripheral bile ducts. Note that hepatocytes are uniformly negative while non-parenchymal cells are uniformly positive. B) IHC analyses of peri-ductal cells highlighting Pten and Sox9 expression in serial sections. Boxed areas are magnified below. Arrows point to Sox9’+’;Pten’−’ cells. Bottom panel highlights immature Sox9’+’;Pten’+’ cells. Note that matured cholangiocytes were also Sox9’+’. C) Co-expression of Sox9 and phospho-Akt (top) or phospho-S6 (bottom) in peri-portal regions. D) Examples of Pten’−’ HCC, Pten’−’ ICC, and Pten’+’ ICC. Note the presence of Pten’+’ stromal cells. E) Examples of Sox9’+’;HepPar1’+’ (arrow) and Sox9’+’;CK19’+’ peri-ductal cells. Original magnification: 400X
Figure 5
Figure 5
Relationship between Akt/mTORC1, ERK and tumor differentiation. A) Expression of phospho-S6, phospho-Akt, and phospho-ERK in ICC (I), HCC (H) and adjacent non-tumor livers (L) based on IHC analyses. Top panel: 100x. Bottom panel: 400x. B) Serial sections of two DKO livers showing early peri-portal mixed tumors. Note contrasting phospho-S6 and phospho-Akt expression in the HCC (arrow) and ICC (arrowhead) components. P, portal vein. Left two columns: 400X. Right two columns: high magnification views of the boxed areas. C) Expression of phospho-ERK in two independent early mixed tumors. Arrowhead: ICC. Arrow: HCC. Original magnification: 400X.
Figure 6
Figure 6
Receptor tyrosine kinase expression in experimental liver tumors. A) Immunoblot analyses of liver tumors (T), adjacent non-tumor livers (−/−) and Cre-negative control livers (C) from the three models using indicated antibodies. B) IHC analyses of PDGFRb and FGFR1 in each of the 3 models. Magnification: 200X. C) FGFR1 expression in an early, peri-portal mixed tumor. P, portal vein. Arrowhead: ICC. Arrow: HCC. D) Immunoblot analyses showing FGFR1 expression and Akt/mTORC1 signaling in human hepatoma cells, HepG2, treated with rapamycin (100nM) (left column) and rat hepatoma cells (McA-RH7777) treated with AZD8055 (80nM) (right column). E) Activation of Akt and MAPK by FGF2 in hepatoma cells is suppressed by PD173074, a selective FGFR1 inhibitor. Arrows indicate p-Akt(Ser473). F) Inhibition of Tsc1−/− tumor (T) Akt and MAPK activities by PD173074 (20 mg/kg ip, daily for four days) compared to vehicle control-treated mice. −/− indicates non-tumor livers.

Similar articles

Cited by

References

    1. Nordenstedt H, White DL, El-Serag HB. The changing pattern of epidemiology in hepatocellular carcinoma. Dig Liver Dis. 2010 Jul;42(Suppl 3):S206–214. - PMC - PubMed
    1. Zucman-Rossi J. Molecular classification of hepatocellular carcinoma. Dig Liver Dis. 2010 Jul;42(Suppl 3):S235–241. - PubMed
    1. Galicia VA, He L, Dang H, et al. Expansion of hepatic tumor progenitor cells in Pten-null mice requires liver injury and is reversed by loss of AKT2. Gastroenterology. 2010 Dec;139(6):2170–2182. - PMC - PubMed
    1. Calvisi DF, Wang C, Ho C, et al. Increased lipogenesis, induced by AKT-mTORC1-RPS6 signaling, promotes development of human hepatocellular carcinoma. Gastroenterology. 2011 Mar;140(3):1071–1083. - PMC - PubMed
    1. Zoncu R, Efeyan A, Sabatini DM. mTOR: from growth signal integration to cancer, diabetes and ageing. Nat Rev Mol Cell Biol. 2011 Jan;12(1):21–35. - PMC - PubMed

Publication types

MeSH terms

Substances