. 2013 May 15:72:227-36.
doi: 10.1016/j.neuroimage.2013.01.049. Epub 2013 Jan 31.

EEG correlates of time-varying BOLD functional connectivity

Affiliations

EEG correlates of time-varying BOLD functional connectivity

Catie Chang et al. Neuroimage. .

Abstract

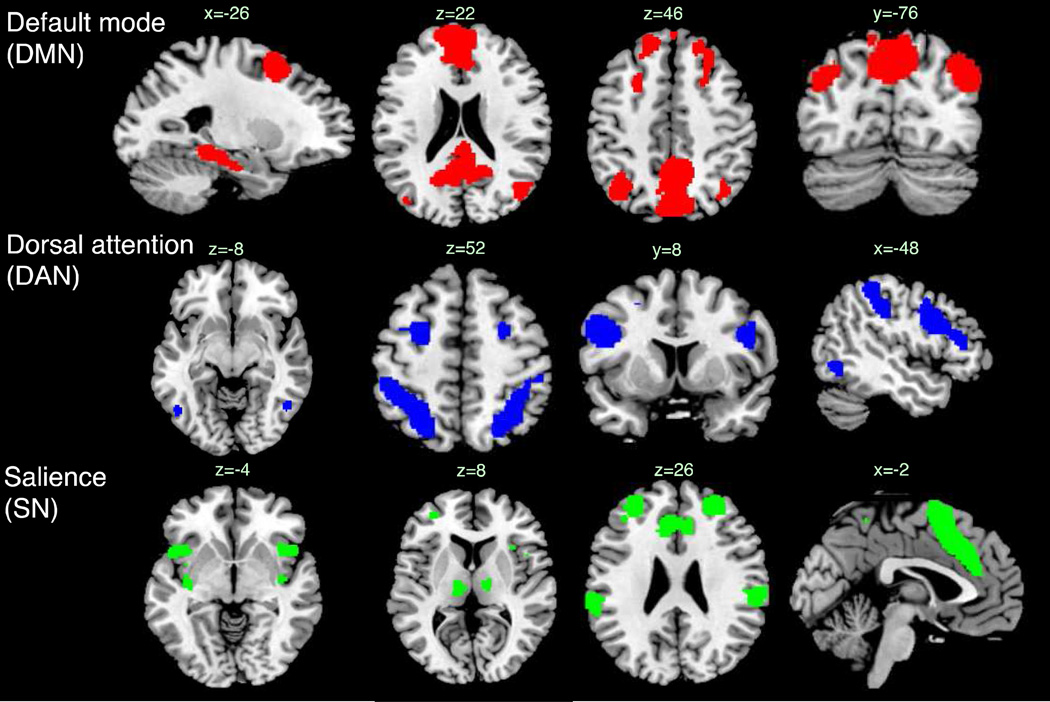
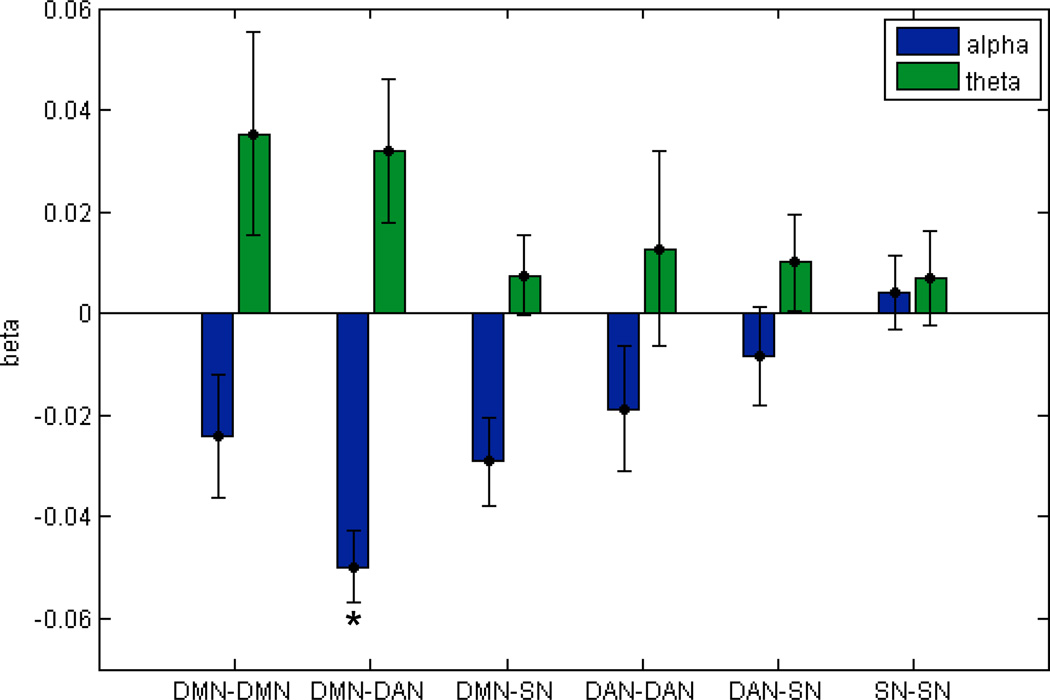
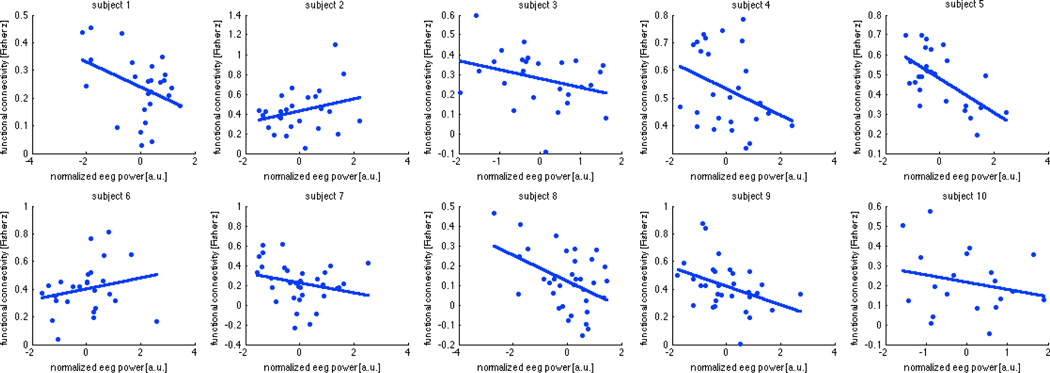
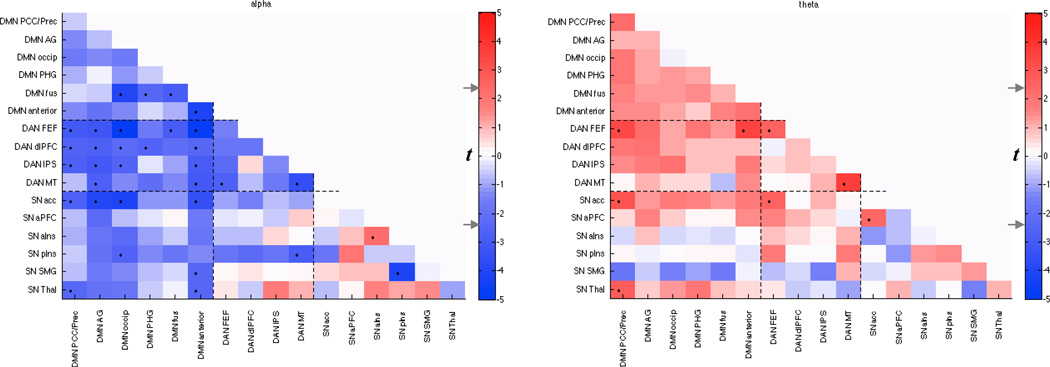
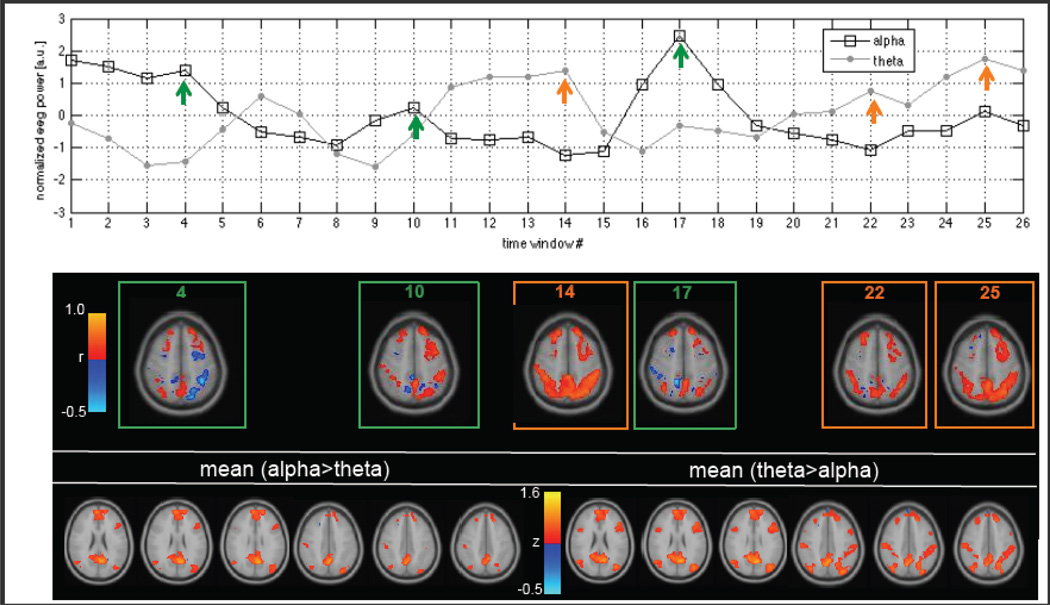
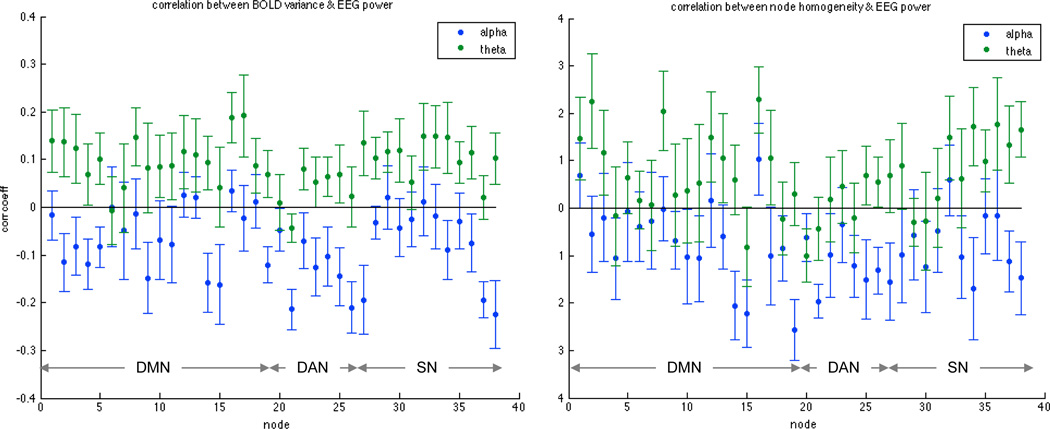
Recent resting-state fMRI studies have shown that the apparent functional connectivity (FC) between brain regions may undergo changes on time-scales of seconds to minutes, the basis and importance of which are largely unknown. Here, we examine the electrophysiological correlates of within-scan FC variations during a condition of eyes-closed rest. A sliding window analysis of simultaneous EEG-fMRI data was performed to examine whether temporal variations in coupling between three major networks (default mode; DMN, dorsal attention; DAN, and salience network; SN) are associated with temporal variations in mental state, as assessed from the amplitude of alpha and theta oscillations in the EEG. In our dataset, alpha power showed a significant inverse relationship with the strength of connectivity between DMN and DAN. In addition, alpha power covaried with the spatial extent of anticorrelation between DMN and DAN, with higher alpha power associated with larger anticorrelation extent. Results suggest an electrical signature of the time-varying FC between the DAN and DMN, potentially reflecting neural and state-dependent variations.


Figures

Figure 1
Figure 1
Networks used in the fMRI connectivity analysis, superimposed on the ch2bet template. Coordinates and node labels are provided in Table 2.
Figure 2
Figure 2
Beta weights (mean ± standard error across subjects, N=10) of the multiple regression of standardized EEG alpha and theta power against temporal changes in functional connectivity between nodes of the default mode (DMN), dorsal attention (DAN), and salience networks (SN). Only the relationship between alpha power and DMN-DAN connectivity was significant at a Bonferroni-corrected level of p<0.05. Sliding window size = 40 s, overlap 50%.
Figure 3
Figure 3
Marginal relationship between sliding-window EEG alpha band power and the sliding-window measure of functional connectivity between default mode and dorsal attention networks (window size = 40 s, overlap 50%), shown for each subject.
Figure 4
Figure 4
Relationship between time-varying EEG power and functional connectivity within and between sub-networks (Table 2) of the DMN, DAN, and SN. Color represents the group-level t-score obtained by regressing sliding-window functional connectivity of sub-network pairs against sliding-window EEG alpha and theta power time series. Since this is an exploratory analysis intended to reveal the overall topographic pattern of the previously established effects, only uncorrected t-values are reported. The t-value corresponding to a 2-sided p=0.05 uncorrected (|t(8)|=2.3) is indicated on the colorbar (gray arrows), and suprathreshold entries are indicated in the matrix by ‘•’.
Figure 5
Figure 5
Relationship between functional connectivity and EEG power in one subject (Subject 5). Top: Time series of temporally normalized sliding-window alpha and theta power, window size = 40 s. Arrows indicate windows selected for visualization of seed-based correlations in the middle panel. Middle: Seed-based correlation maps at the indicated windows. The seed was a single node in the DMN (posterior cingulate cortex), and correlations were computed for each voxel in the DMN and DAN. Bottom: Seed-based functional connectivity maps averaged over all time windows for which normalized alpha power exceeded normalized theta power (bottom left), and vice versa (bottom right). Color represents Fisher z score.
Figure 6
Figure 6
Relationship between EEG power and time-varying changes in (left) BOLD signal variance and (right) within-node homogeneity. Plots show the mean (± standard error, N=10) of correlation coefficients across subjects, and data were obtained using a window size of 40 s. Ordering of nodes is consistent with Table 2.

References

    1. Allen PJ, Josephs O, Turner R. A method for removing imaging artifact from continuous EEG recorded during functional MRI. Neuroimage. 2000;12:230–239. - PubMed
    1. Beckmann CF, DeLuca M, Devlin JT, Smith SM. Investigations into resting-state connectivity using independent component analysis. Philos Trans R Soc Lond B Biol Sci. 2005;360:1001–1013. - PMC - PubMed
    1. Birn RM, Diamond JB, Smith MA, Bandettini PA. Separating respiratoryvariation-related fluctuations from neuronal-activity-related fluctuations in fMRI. Neuroimage. 2006;31:1536–1548. - PubMed
    1. Boveroux P, Vanhaudenhuyse A, Bruno MA, Noirhomme Q, Lauwick S, Luxen A, Degueldre C, Plenevaux A, Schnakers C, Phillips C, Brichant JF, Bonhomme V, Maquet P, Greicius MD, Laureys S, Boly M. Breakdown of within-and between-network resting state functional magnetic resonance imaging connectivity during propofol-induced loss of consciousness. Anesthesiology. 2010;113:1038–1053. - PubMed
    1. Brookes MJ, Woolrich MW, Luckhoo H, Price D, Hale J, Stephenson M, Barnes G, Smith SM, Morris P. The Electrophysiological Basis of Resting State Networks. Proc. Intl. Soc. Mag. Reson. Med. 20, Proc. Intl. Soc. Mag. Reson. Med, Melbourne, Australia. 2012:132. - PMC - PubMed

Publication types