. 2013 Feb 20;32(4):566-82.
doi: 10.1038/emboj.2013.8. Epub 2013 Feb 1.

TMEM59 defines a novel ATG16L1-binding motif that promotes local activation of LC3

Affiliations

TMEM59 defines a novel ATG16L1-binding motif that promotes local activation of LC3

Emilio Boada-Romero et al. EMBO J. .

Abstract

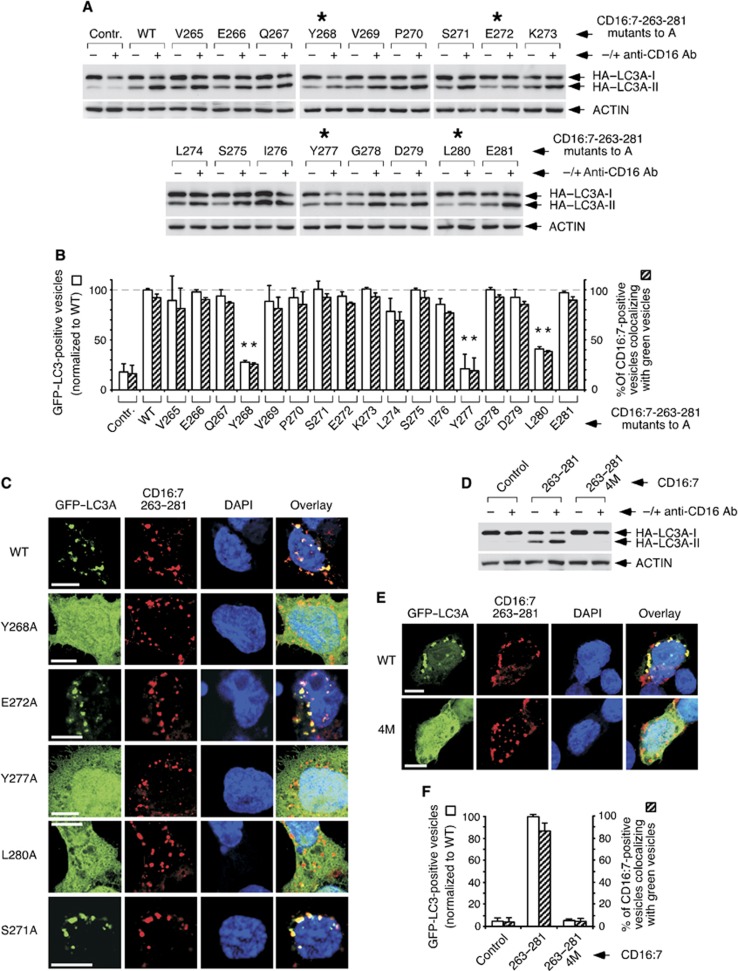
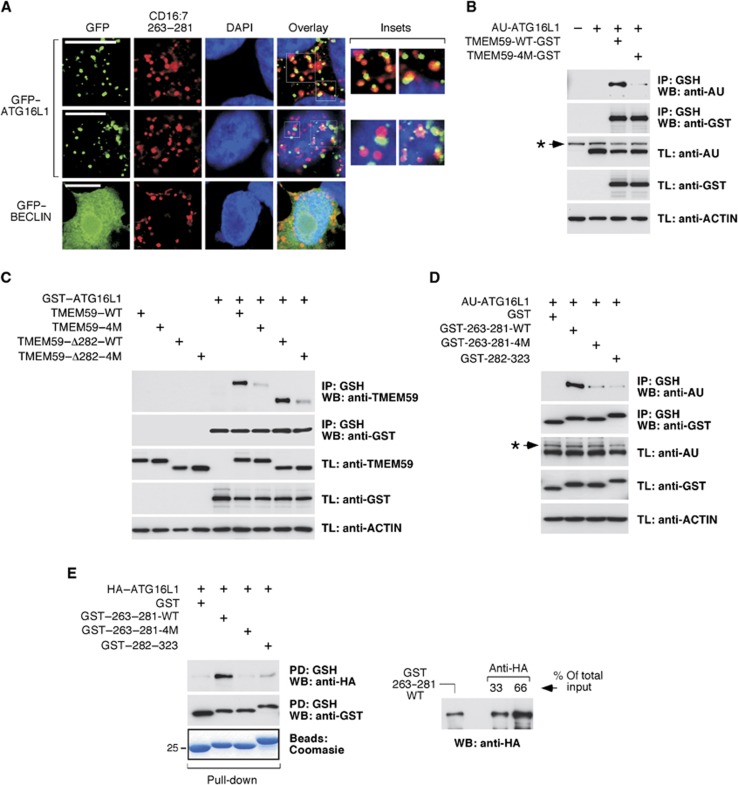
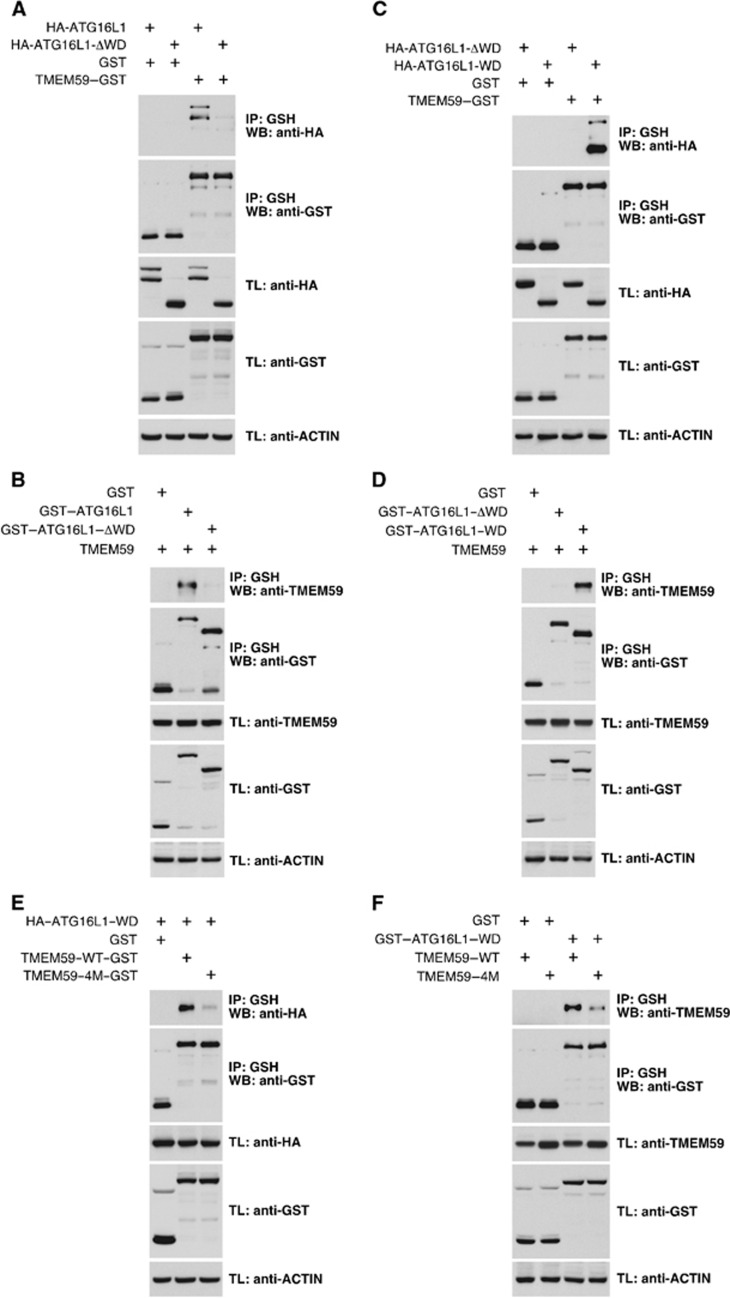
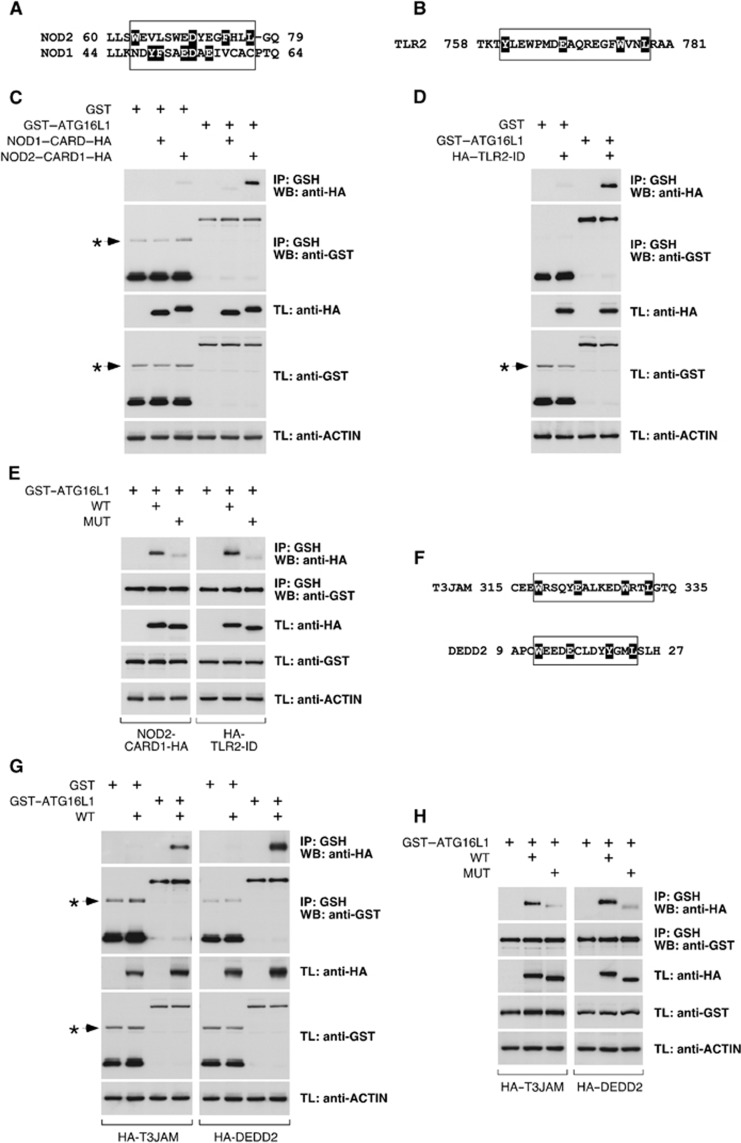
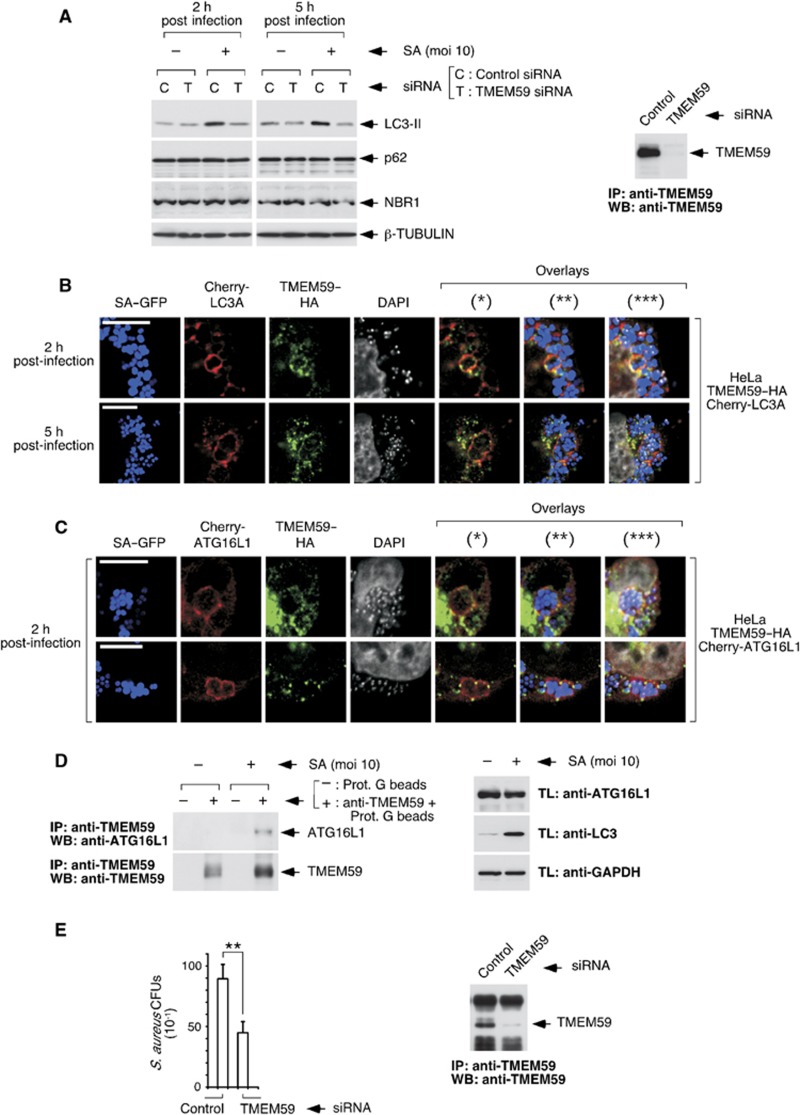
Selective autophagy underlies many of the important physiological roles that autophagy plays in multicellular organisms, but the mechanisms involved in cargo selection are poorly understood. Here we describe a molecular mechanism that can target conventional endosomes for autophagic degradation. We show that the human transmembrane protein TMEM59 contains a minimal 19-amino-acid peptide in its intracellular domain that promotes LC3 labelling and lysosomal targeting of its own endosomal compartment. Interestingly, this peptide defines a novel protein motif that mediates interaction with the WD-repeat domain of ATG16L1, thus providing a mechanistic basis for the activity. The motif is represented with the same ATG16L1-binding ability in other molecules, suggesting a more general relevance. We propose that this motif may play an important role in targeting specific membranous compartments for autophagic degradation, and therefore it may facilitate the search for adaptor proteins that promote selective autophagy by engaging ATG16L1. Endogenous TMEM59 interacts with ATG16L1 and mediates autophagy in response to Staphylococcus aureus infection.


Conflict of interest statement

The authors declare that they have no conflict of interest.

Figures

Figure 1
Figure 1
TMEM59 induces LC3 activation. (A) Clone P15 induces HA–LC3 lipidation. 293T cells were transfected with P15 plus plasmids expressing HA–LC3A and/or the apoptotic inhibitor p35 (as shown), and lysed for western blotting against the indicated molecules (anti-HA for HA–LC3A). The figure shows that expression of P15 induces HA–LC3A conversion to a lower molecular weight form indicative of protein lipidation. This activity remains unchanged by p35. (B) P15 induces GFP–LC3 translocation to a vesiculated pattern. 293T cells were transfected with the indicated plasmids mixed with vectors expressing GFP–LC3A and p35. The known autophagic inducer bNIP3L constituted a positive control. Representative confocal pictures are shown. (C) TMEM59 induces HA–LC3 lipidation in different cell lines lacking the SV40 large T-antigen plasmid amplification system. Cells were transfected with the shown plasmids, vectors expressing HA–LC3A (left) or HA–LC3B (right) and GST (as transfection control), and lysed for western blotting against the indicated molecules. (D) TMEM59 induces GFP–LC3 activation. 293 cells were transfected with the indicated plasmids and GFP–LC3A (top) or GFP–LC3B (bottom). Representative confocal pictures are shown. (E) Quantification of the phenotype in D. The number of GFP–LC3-positive vesicles per transfected cell was scored for at least fifty cells. Data are expressed as means ±s.d. of one representative experiment of three repetitions. Source data for this figure is available on the online supplementary information page.
Figure 2
Figure 2
The ID of TMEM59 is necessary and sufficient for LC3 activation. (A) TMEM59 ID is required for HA–LC3 lipidation. 293 cells were transfected with full-length TMEM59 (FL) or a deleted version lacking the ID (ΔID, Δ263–323), HA–LC3A (left) or HA–LC3B (right) and GST. Cells were lysed for western blotting against the shown molecules. (B) The ID is necessary for GFP–LC3 activation. 293 cells were transfected with the indicated TMEM59 constructs and GFP–LC3A or GFP–LC3B (as indicated). Representative confocal pictures are shown. (C) Quantification of the phenotype in B. Scoring and data expression were as in Figure 1E. (D) TMEM59 ID (amino acids 263–323) suffices for HA–LC3A lipidation. 293 cells were transfected with the indicated CD16:7 chimera (Control: empty chimera) and vectors encoding HA–LC3A and GST, subjected to aggregation with the shown amounts of anti-CD16 antibody and lysed for western blotting. The right panel shows control WBs demonstrating equal loading (ACTIN), transfection (GST) and chimera expression (CD16) in unaggregated samples, as all experimental points per chimera derive from a single transfection. (E) Comparable surface levels of CD16:7 constructs. Transfected 293 cells were processed for anti-CD16 flow cytometry. The graph displays percentages of positive cells (left axis) and means of fluorescence of positive cells (MF, right axis) obtained from triplicates. Data are expressed as means ±s.d. of the triplicates. (F) The ID suffices for HA–LC3B lipidation. (G) The ID suffices for GFP–LC3 activation. 293 cells were transfected with the indicated chimeras and GFP–LC3A or GFP–LC3B, aggregated and mounted. Representative confocal pictures are shown. Activated GFP–LC3 appears as a collapsed mass of indiscernible vacuoles. (H) Quantification of the phenotype in G. As individual vesicles could not be counted, quantification was done as the percentage of transfected cells showing redistributed GFP–LC3. At least 10 different fields were counted (about 400 cells). The experiment was repeated three times. Data are expressed as means ±s.d. of the triplicates. Source data for this figure is available on the online supplementary information page.
Figure 3
Figure 3
A minimal 19-amino-acid subdomain between amino acids 263–281 holds the autophagic activity of TMEM59. (A, B) Ability of serial C-terminal deletions of TMEM59 to activate LC3. 293 cells were transfected with the indicated TMEM59 C-terminal deletions, HA–LC3A (A) or HA–LC3B (B) and GST, and lysed for western blotting against the indicated molecules. (C) Amino acids 263–281 retain the full potential of TMEM59 ID to promote HA–LC3 conversion. 293 cells were transfected with the shown CD16:7 chimeras, HA–LC3A or HA–LC3B (as indicated) and GST, and subjected to anti-CD16 aggregation before lysing them for western blotting. The lower panels show control WBs (unaggregated samples). (D) Amino acids 263–281 suffice for GFP–LC3 activation and retain the full potential of TMEM59 ID to promote GFP–LC3 activation. 293 cells were transfected with the indicated CD16:7 chimeras and GFP–LC3A or GFP–LC3B (as indicated), and subjected to anti-CD16 aggregation before fixing them for microscopy. The graph shows percentages of transfected cells exhibiting redistributed GFP–LC3. Quantification and data expression were done as in Figure 2H. (E) Amino acids 282–323 of TMEM59 lack LC3 activation potential. 293 cells were transfected with the shown chimeras, HA–LC3A or HA–LC3B and GST, and processed for western blotting against the indicated molecules. Control WBs of unaggregated samples are shown in the lower panels. (F) Surface expression levels of CD16:7 chimeras. Procedures and data expression were as in Figure 2E. The figure shows that the functional differences observed between CD16:7 chimeras (C–E) are not caused by differential surface expression. (G) Scheme of TMEM59 showing amino-acid positions and the minimal active subdomain (amino acids 263–281). ED, extracellular domain; TM, transmembrane domain. Source data for this figure is available on the online supplementary information page.
Figure 4
Figure 4
The minimal active subdomain of TMEM59 promotes LC3 labelling and lysosomal degradation of its own vesicular compartment. (A) Endocytic vesicles containing aggregated CD16:7–263–281 become labelled with GFP–LC3. JAR cells were transfected with vectors expressing the indicated CD16:7 chimeras and GFP–LC3A, and subjected to anti-CD16 aggregation for 8 h before staining for the endocytosed chimera (red). Representative confocal pictures are shown. The inset highlights a vesicle where the peripheral GFP–LC3 staining is particularly distinguishable. The right panel displays control WBs showing that chimera aggregation for 8 h activates HA–LC3A conversion in JAR cells. (B) Colocalization of endocytosed CD16:7–263–281 with EEA1 and CD63. JAR cells were transfected with CD16:7–263–281 and subjected to aggregation before staining them for the endocytosed chimera (red) and EEA1 or CD63 (green; FITC-coupled primary antibodies), as indicated. Representative confocal pictures are shown. (C) Immunoelectron microscopy assay showing that endocytosed CD16:7–263–281 localizes to LC3-labelled, single-membrane vesicles. JAR cells were transfected with the CD16:7–263–281 chimera and a construct expressing human IgG1 fused to LC3A. Cells were subjected to anti-CD16 aggregation for 8 h and processed for immunoelectron microscopy. Thick gold signal (18 nm): aggregated, endocytosed chimera; thin gold signal (12 nm): IgG1–LC3. Arrows indicate single membrane (black) or IgG1–LC3A (white). Scale bar: 400 nm. (D) Lysosomal inhibition increases HA–LC3II levels promoted by CD16:7–263–281. 293 cells were transfected with the indicated chimera and HA–LC3A, and subjected to anti-CD16 aggregation in the absence or presence of bafilomycin (200 nM, added 4 h post aggregation) before lysing them for western blotting against the indicated molecules. (E) Aggregation of CD16:7–263–281 promotes its own degradation. 293 cells were transfected with the indicated constructs, aggregated and lysed for western blotting. Shown are overexposed anti-CD16 WBs. (F) Degradation of CD16:7–263–281 is inhibited by ATG5 depletion. 293 cells were transfected with the indicated siRNAs and subsequently with the shown CD16:7 constructs, aggregated and lysed for anti-CD16 western blotting (left panel). The right panel displays control WBs showing ATG5 depletion. Source data for this figure is available on the online supplementary information page.
Figure 5
Figure 5
Alanine scanning approach to identify amino acids in the active subdomain of TMEM59 that are essential for LC3 activation. (A) Identification of critical amino acids for HA–LC3 conversion. 293 cells were transfected with the indicated CD16:7–263–281 mutants and HA–LC3A, subjected to anti-CD16 aggregation and lysed for western blotting against the indicated molecules. Asterisks mark mutations with reduced activity. Shown is one representative experiment of six repetitions. (B) Identification of critical amino acids for GFP–LC3 activation and colocalization with the endocytosed chimera. JAR cells were transfected with the indicated CD16:7–263–281 mutants and GFP–LC3A, aggregated and stained for the endocytosed chimera (red). Preparations were scored by blindly counting the number of red vesicles (chimera) and green vesicles (GFP–LC3A) per cell, as well as the number of red vesicles colocalizing with green ones. The percentage of green vesicles colocalizing with red ones was close to 100% for all mutants, that is, virtually no GFP–LC3A vesicles were unrelated to endocytosed chimera (not shown). At least 50 cells were scored per experimental point. The experiment was repeated three times. The graph shows the number of GFP–LC3A vesicles per cell expressed as the percentage of the value obtained for the wild-type chimera (left axis), and the percentage of chimera vesicles labelled with GFP–LC3A (right axis). Data are expressed as means ±s.d. of the triplicates. Asterisks indicate significant differences with respect to wild-type values (paired Student’s t-test; P<0.01). (C) Representative confocal pictures of the phenotype produced by the indicated mutations. Procedures were as in B. (D) Simultaneous mutation of the four essential amino acids to alanine blocks HA–LC3 conversion induced by CD16:7–263–281. 293 cells were transfected with the indicated chimeras (4M, quadruple mutant) and HA–LC3A, aggregated and lysed for western blotting. (E) Simultaneous mutation of the four essential amino acids blocks GFP–LC3 activation and colocalization with the endocytosed chimera. JAR cells were transfected with the indicated CD16:7–263–281 constructs and GFP–LC3A, aggregated and stained for the endocytosed chimera (red). Representative confocal images are shown. (F) Quantification of the phenotype in E. Data gathering and expression were as in B. Source data for this figure is available on the online supplementary information page.
Figure 6
Figure 6
The minimal active subdomain of TMEM59 directly binds ATG16L1 through the identified functional motif. (A) Apposition events between GFP–ATG16L1 and endocytosed CD16:7–263–281. JAR cells were transfected with CD16:7–263–281 and GFP–ATG16L1 or GFP–BECLIN (as indicated), aggregated for 4 h and stained for the endocytosed chimera (red). Representative confocal pictures are shown. Two different examples are provided for GFP–ATG16L1. (BD) 293T cells were transfected with the indicated constructs, lysed and subjected to GST immunoprecipitation using agarose beads coupled to glutathione (IP, immunoprecipitation; TL, total lysate). Shown are WBs against the indicated molecules. (B) AU–ATG16L1 co-precipitates with wild-type (WT) TMEM59–GST but not with a mutated version where the four essential amino acids were mutated to alanine (TMEM59–4M–GST). (C) Full-length TMEM59 and TMEM59–Δ282 co-precipitate with GST–ATG16L1, whereas the respective 4M versions do not. (D) AU–ATG16L1 co-precipitates with a fusion protein between GST and the minimal active peptide of TMEM59 (GST–263–281), but not with a 4M version (GST–263–281–4M) or a GST fusion protein with the inactive portion of TMEM59–ID (GST–282–323). (E) HA–ATG16L1 expressed in bacteria co-precipitates with a GST–263–281 recombinant protein purified from bacterial cultures, but not with a 4M version of the same construct or GST–282–323. The indicated GST partners were expressed in bacteria and purified using agarose beads coupled to glutathione. The loaded beads were then used for HA–ATG16L1 pull-down from crude bacterial lysates. Shown are WBs against the indicated molecules (PD, pull-down). A Coomasie staining of a protein gel with the purified GST fusion proteins is shown. The right panel compares the amount of HA–ATG16L1 pulled down by GST–263–281 with the signal provided by direct anti-HA immunoprecipitation. This result shows that about 20–25% of the available HA–ATG16L1 protein is precipitated by GST–263–281. Asterisks indicate irrelevant bands in B and D. Source data for this figure is available on the online supplementary information page.
Figure 7
Figure 7
The ATG16L1-binding motif present in TMEM59 recognizes the WD-repeat domain of ATG16L1. (A–F) 293T cells were transfected with the indicated constructs, lysed and subjected to GST immunoprecipitation with agarose beads coupled to glutathione. Shown are WBs against the indicated molecules. (A) A deleted version of ATG16L1 lacking the WD domain (HA–ATG16L1–ΔWD) does not co-precipitate with TMEM59–GST. (B) TMEM59 does not co-precipitate with ATG16L1–ΔWD fused to GST. (C) The WD domain of ATG16L1 (HA–ATG16L1–WD) suffices to co-precipitate with TMEM59–GST. (D) TMEM59 co-precipitates with ATG16L1–WD fused to GST. (E) HA–ATG16L1–WD does not bind a 4M version of TMEM59–GST. (F) TMEM59–4M does not co-precipitate with the ATG16L1–WD fused to GST. Source data for this figure is available on the online supplementary information page.
Figure 8
Figure 8
The ATG16L1-binding motif is present with a similar ATG16L1-binding capacity in other molecules. (A) Alignment of the region that includes the motif in NOD2 with the same area in NOD1. The relevant amino-acid stretch is boxed. Individual amino-acid highlighting (black) in NOD2 indicates the residues identified by the Prosite algorithm as part of the motif. In NOD1, all residues that could be part of an eventual motif are highlighted to indicate that they form an incomplete motif. (B) Amino-acid region in TLR2 that includes the motif. Highlighting indicates residues identified by Prosite as part of the motif. (C, D, E, G, H) 293T cells were transfected with the indicated constructs, lysed and subjected to GST immunoprecipitation with agarose beads coupled to glutathione. Shown are WBs against the indicated molecules. (C) The N-terminal CARD of NOD2 (NOD2–CARD1–HA), but not the CARD of NOD1 (NOD1–CARD–HA), co-precipitates with GST–ATG16L1. (D) The ID of TLR2 (HA–TLR2–ID) co-precipitates with GST–ATG16L1. (E) Mutated versions (MUT) of NOD2–CARD1–HA and HA–TLR2–ID (as shown) do not co-precipitate with GST–ATG16L1. (F) Amino-acid sequences of T3JAM and DEDD2 including the motif. Residues identified by the Prosite algorithm are highlighted. (G) Wild-type (WT) versions of HA–T3JAM and HA–DEDD2 (as indicated) co-precipitate with GST–ATG16L1. (H) Mutated versions (MUT) of HA–T3JAM and HA–DEDD2 do not co-precipitate with GST–ATG16L1. Asterisks indicate irrelevant bands in C, D and G. Source data for this figure is available on the online supplementary information page.
Figure 9
Figure 9
Endogenous TMEM59 mediates LC3 activation and interacts with ATG16L1 in response to S. aureus (SA) infection. (A) Depletion of TMEM59 inhibits LC3II generation by SA at early infection times. HeLa cells were transfected with the indicated siRNAs and, 48 h later, infected with the bacteria (SA) for the shown times before lysing them for western blotting against the indicated molecules. The right panel shows successful TMEM59 depletion (rabbit anti-TMEM59 immunoprecipitation plus chicken anti-TMEM59 WB). (B) Colocalization events between bacteria (GFP labelled), TMEM59–HA and Cherry–LC3A in infected cells. HeLa cells stably expressing TMEM59–HA and Cherry–LC3A were infected for the indicated times (moi=10), and processed for anti-HA immunofluorescence. Representative confocal images are shown. The GFP, anti-HA (Cy5) and DAPI signals were pseudocolored in blue, green and white, respectively. Asterisks indicate overlay images: (*), Cherry–LC3A/TMEM59; (**), Cherry–LC3A/TMEM59/bacteria; (***), Cherry–LC3A/TMEM59/bacteria/DAPI. (C) Colocalization between bacteria, TMEM59–HA and Cherry–ATG16L1. HeLa cells stably expressing TMEM59–HA and Cherry–ATG16L1 were infected with SA (2 h, moi=10), and processed for anti-HA immunofluorescence. Shown are confocal pictures displaying two representative examples. Asterisks indicate overlays as in B. (D) SA promotes co-precipitation of endogenous ATG16L1 with endogenous TMEM59. HeLa cells were infected with SA (2 h, moi=10), lysed and subjected to immunoprecipitation with anti-TMEM59 antibodies or irrelevant protein G beads (as indicated). Immunoprecipitates were processed for western blotting. The right panel shows control WBs of the lysates used for immunoprecipitation. (E) Depletion of TMEM59 reduces recovery of SA from infected cells. HeLa cells were transfected with the indicated siRNAs, infected with SA 96 h later (5 h, moi=0.1) and lysed for CFU evaluation. The experiment was carried out three independent times. The graph displays average CFU counts obtained for the 10−1 dilution of the relevant extracts, ±s.d. of the three data sets. Asterisks indicate significant differences (P<0.01, paired Student’s t-test). The right panel shows successful TMEM59 depletion (anti-TMEM59 immunoprecipitation plus anti-TMEM59 WB). Source data for this figure is available on the online supplementary information page.

Similar articles

Cited by

References

    1. Alcalá S, Klee M, Fernandez J, Fleischer A, Pimentel-Muiños FX (2008) A high-throughput screening for mammalian cell death effectors identifies the mitochondrial phosphate carrier as a regulator of cytochrome c release. Oncogene 27: 44–54 - PubMed
    1. Bonifacino JS, Traub LM (2003) Signals for sorting of transmembrane proteins to endosomes and lysosomes. Annu Rev Biochem 72: 395–447 - PubMed
    1. Cadwell K, Stappenbeck TS, Virgin HW (2009) Role of autophagy and autophagy genes in inflammatory bowel disease. Curr Top Microbiol Immunol 335: 141–167 - PubMed
    1. Campoy E, Colombo MI (2009) Autophagy in intracellular bacterial infection. Biochim Biophys Acta 1793: 1465–1477 - PubMed
    1. Cecconi F, Levine B (2008) The role of autophagy in mammalian development: cell makeover rather than cell death. Dev Cell 15: 344–357 - PMC - PubMed

Publication types

MeSH terms