. 2013 Feb 14;494(7436):234-7.
doi: 10.1038/nature11867. Epub 2013 Feb 3.

Finding the sources of missing heritability in a yeast cross

Affiliations

Finding the sources of missing heritability in a yeast cross

Joshua S Bloom et al. Nature. .

Abstract

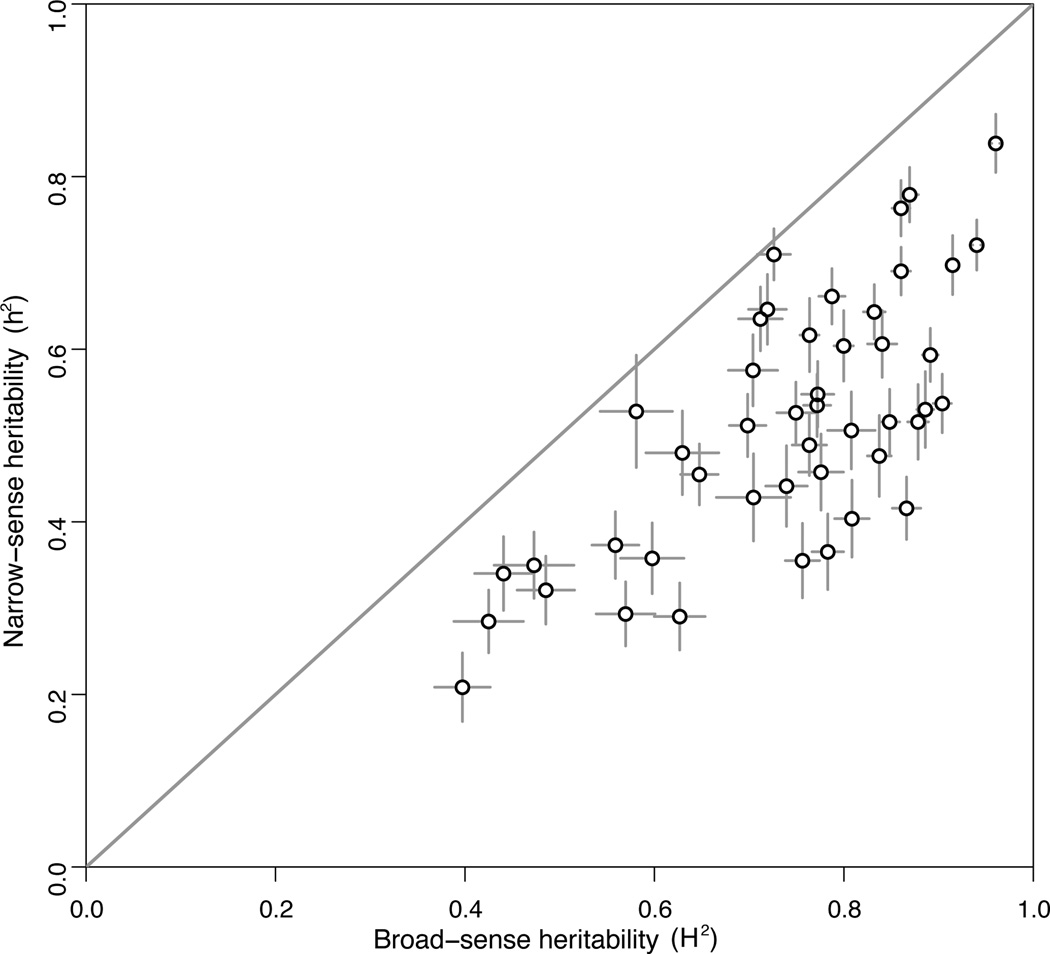
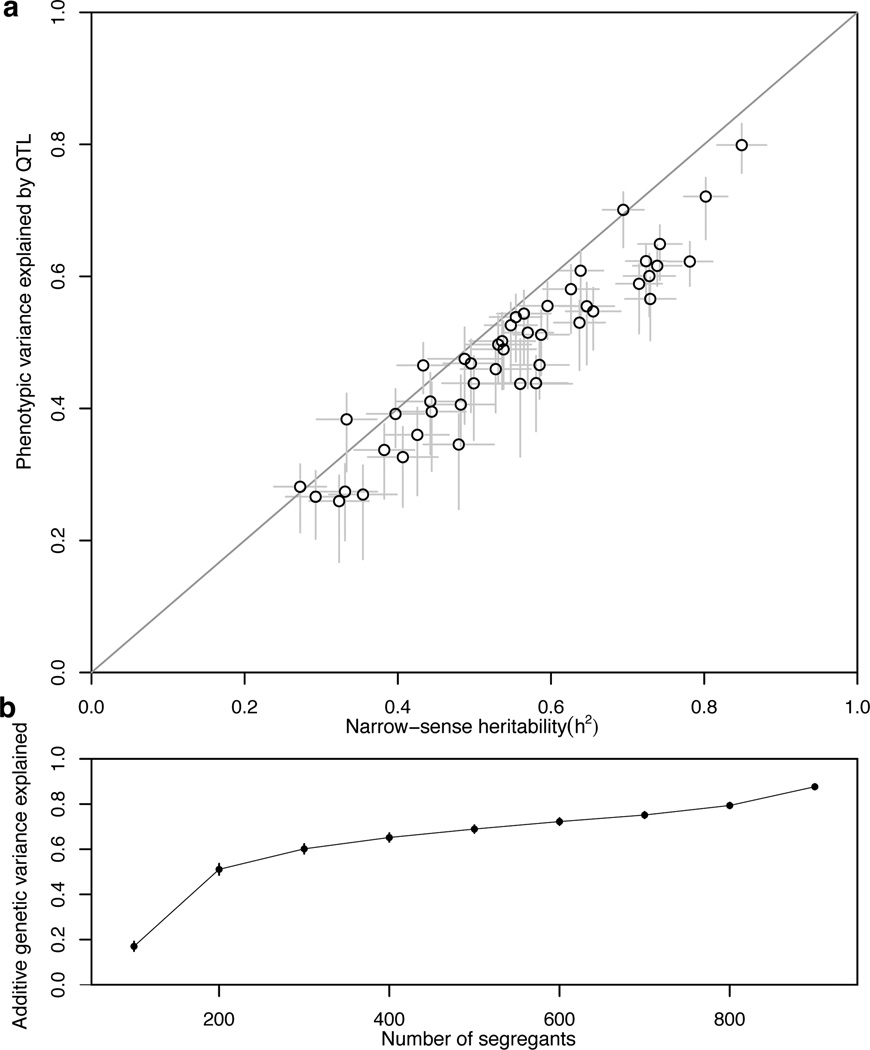
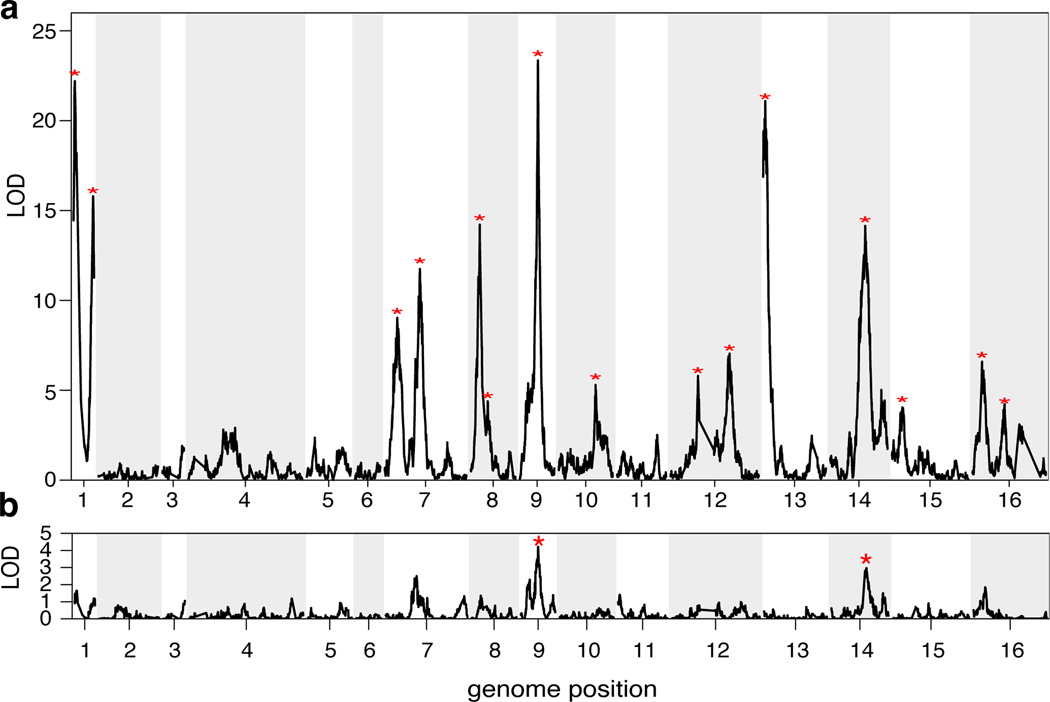
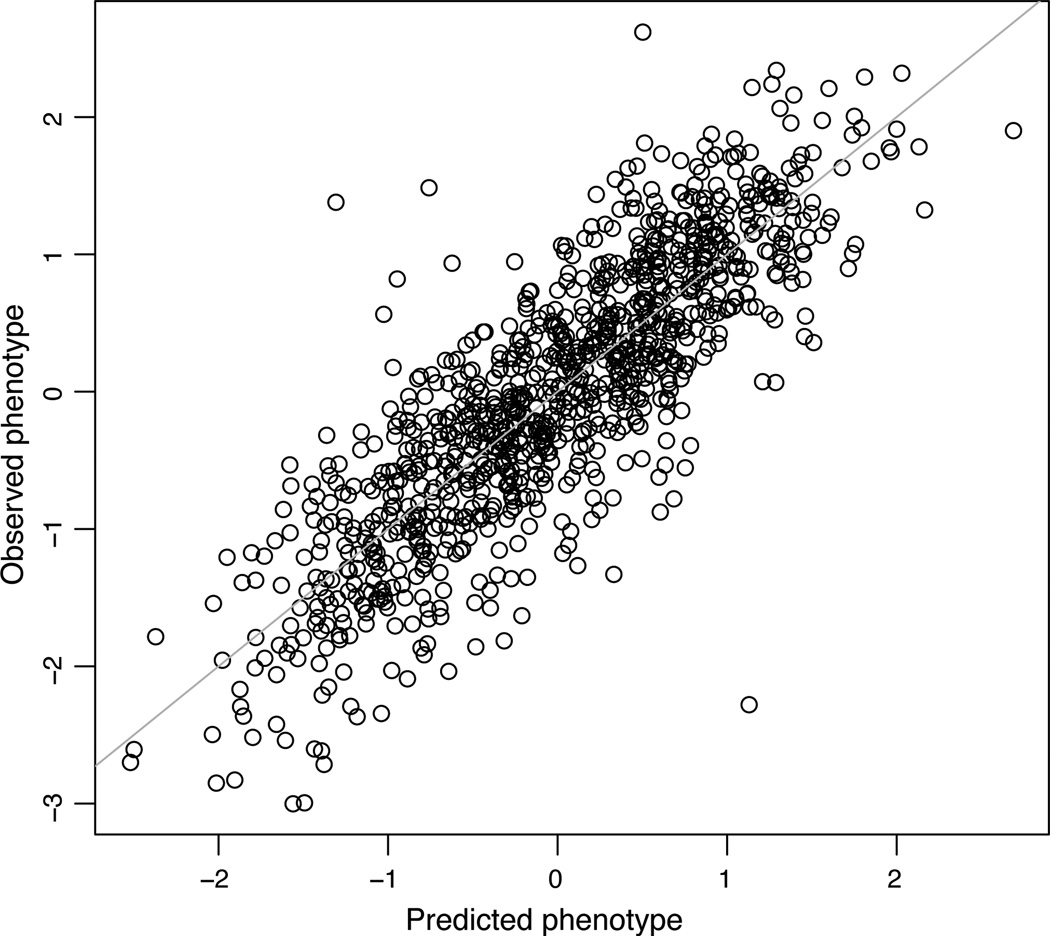
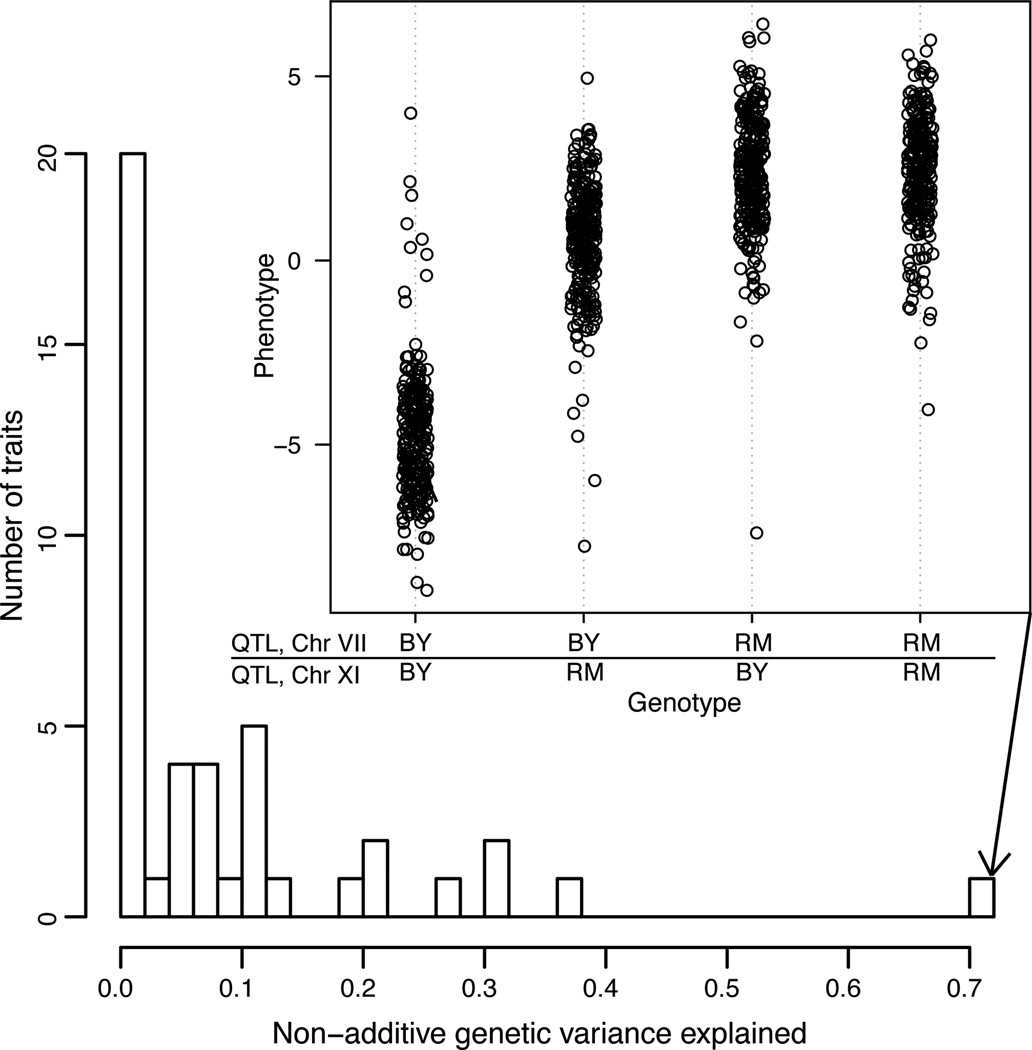
For many traits, including susceptibility to common diseases in humans, causal loci uncovered by genetic-mapping studies explain only a minority of the heritable contribution to trait variation. Multiple explanations for this 'missing heritability' have been proposed. Here we use a large cross between two yeast strains to accurately estimate different sources of heritable variation for 46 quantitative traits, and to detect underlying loci with high statistical power. We find that the detected loci explain nearly the entire additive contribution to heritable variation for the traits studied. We also show that the contribution to heritability of gene-gene interactions varies among traits, from near zero to approximately 50 per cent. Detected two-locus interactions explain only a minority of this contribution. These results substantially advance our understanding of the missing heritability problem and have important implications for future studies of complex and quantitative traits.


Figures

Figure 1
Figure 1. Heritability for 46 yeast traits
The broad-sense heritability (H2) for each trait (X-axis) is plotted against the narrow-sense heritability (h2; Y-axis). Error bars show standard errors in heritability estimates. The diagonal line represents h2 = H2 and is shown as a visual guide.
Figure 2
Figure 2. Most additive heritability is explained by detected QTL
(A) The narrow-sense heritability (h2) for each trait (X-axis) is plotted against the total variance explained by detected QTL (Y-axis). Error bars show standard errors. The diagonal line represents (variance explained by detected QTL) = h2 and is shown as a visual guide. (B) The average fraction of additive genetic variance explained (Y-axis) is plotted against number of segregants used for QTL detection (X-axis). Error bars show standard errors. Alternating shaded bands denote chromosome boundaries.
Figure 3
Figure 3. QTL detection for a complex trait
LOD score (log10 of the odds ratio for linkage) is plotted against the genetic map. Red stars indicate statistically significant QTL. (A) LOD score plot with 1005 segregants for growth in E6-berbamine. (B) LOD score plot with 100 segregants for growth in E6-berbamine. The 15 significant QTL in A explain 78% of the narrow-sense heritability, compared with 21% for the 2 significant QTL in B.
Figure 4
Figure 4. Prediction of segregant trait values from QTL phenotypes
The observed phenotypic values for growth in lithium chloride (Y-axis) are plotted against the predicted phenotypic values based on a cross-validated additive model of 22 QTL. The additive QTL model explains 88% of the narrow-sense heritability. The diagonal line represents (observed phenotype) = (predicted phenotype) and is shown as a visual guide.
Figure 5
Figure 5. Non-additive genetic variance explained by QTL-QTL interactions
A histogram of the fraction of non-additive genetic variance explained by detected QTL-QTL interactions per trait is plotted. The histogram is restricted to traits for which at least 10% of the total genetic variation is non-additive. (Inset) Phenotypes for growth in maltose are shown, grouped by two-locus genotypes at the two interacting QTL on chromosomes VII and XI. This QTL-QTL interaction explained 71% of the difference between broad-sense and narrow-sense heritability.

Comment in

  • Complex traits: Missing in action.
    Muers M. Muers M. Nat Rev Genet. 2013 Apr;14(4):237. doi: 10.1038/nrg3447. Epub 2013 Feb 19. Nat Rev Genet. 2013. PMID: 23419279 No abstract available.

Similar articles

Cited by

References

    1. Manolio TA, et al. Finding the missing heritability of complex diseases. Nature. 2009;461:747–753. - PMC - PubMed
    1. Hill WG. Understanding and using quantitative genetic variation. Philosophical Transactions of the Royal Society B: Biological Sciences. 2010;365:73–85. - PMC - PubMed
    1. Mackay TFC, Stone EA, Ayroles JF. The genetics of quantitative traits: challenges and prospects. Nat Rev Genet. 2009;10:565–577. - PubMed
    1. Buckler ES, et al. The Genetic Architecture of Maize Flowering Time. Science. 2009;325:714–718. - PubMed
    1. Atwell S, et al. Genome-wide association study of 107 phenotypes in Arabidopsis thaliana inbred lines. Nature. 2010;465:627–631. - PMC - PubMed

Additional References

    1. Amberg DC, Burke D, Strathern JN. Methods in yeast genetics : a Cold Spring Harbor Laboratory course manual. xvii. Cold Spring Harbor, N.Y.: Cold Spring Harbor Laboratory Press; 2005. Cold Spring Harbor Laboratory; p. 230.
    1. R Development Core Team. R: A Language and Environment for Statistical Computing. Vienna, Austria: R Foundation for Statistical Computing; 2012.
    1. Li H, Durbin R. Fast and accurate short read alignment with Burrows-Wheeler transform. Bioinformatics. 2009;25:1754–1760. - PMC - PubMed
    1. Li H, et al. The Sequence Alignment/Map format and SAMtools. Bioinformatics. 2009;25:2078–2079. - PMC - PubMed
    1. Broman KW, Wu H, Sen S, Churchill GA. R/qtl: QTL mapping in experimental crosses. Bioinformatics. 2003;19:889–890. - PubMed

Publication types