

Quantitative evaluation of skeletal muscle defects in second harmonic generation images
- PMID: 23377006
- PMCID: PMC3564230
- DOI: 10.1117/1.JBO.18.2.026005
Quantitative evaluation of skeletal muscle defects in second harmonic generation images
Abstract
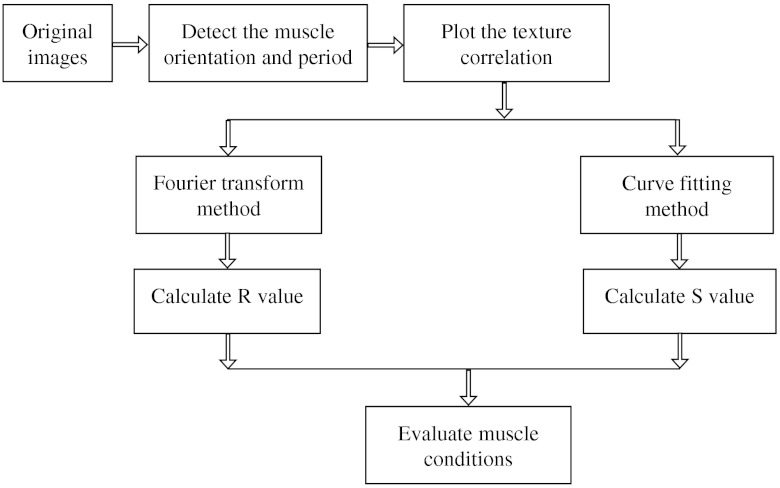
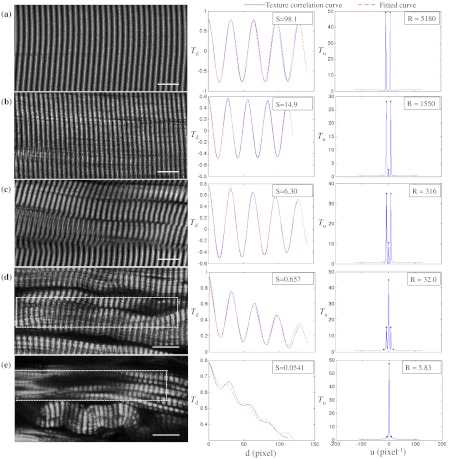
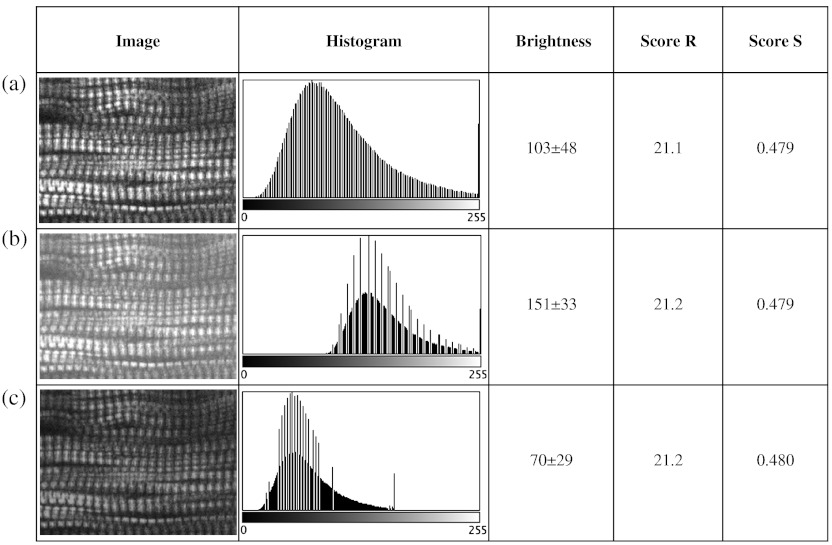
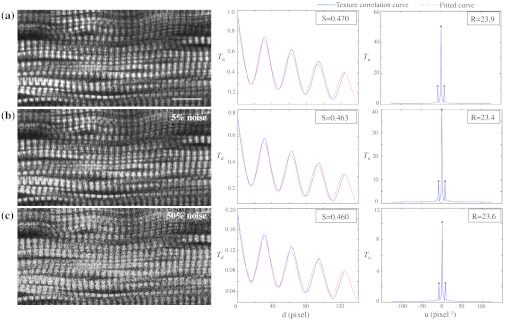
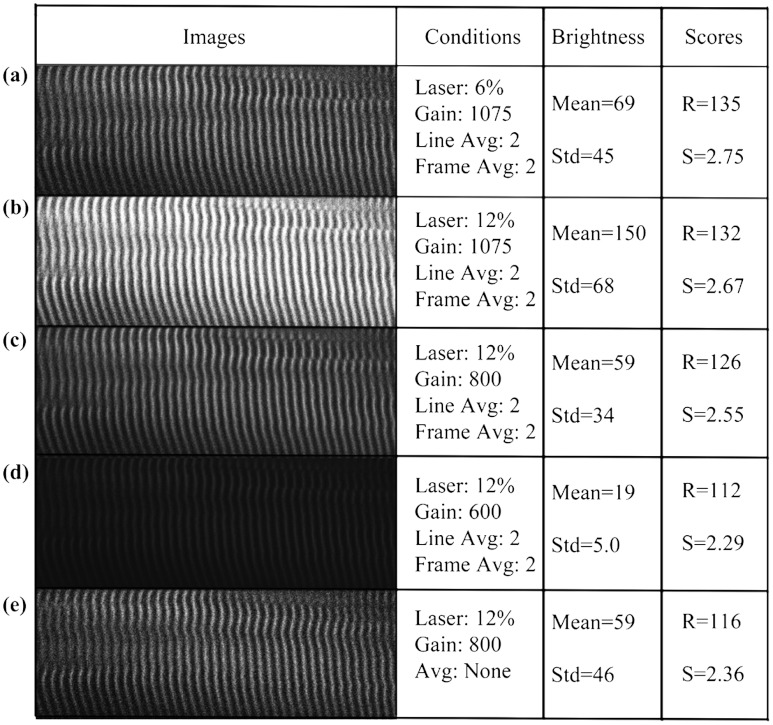
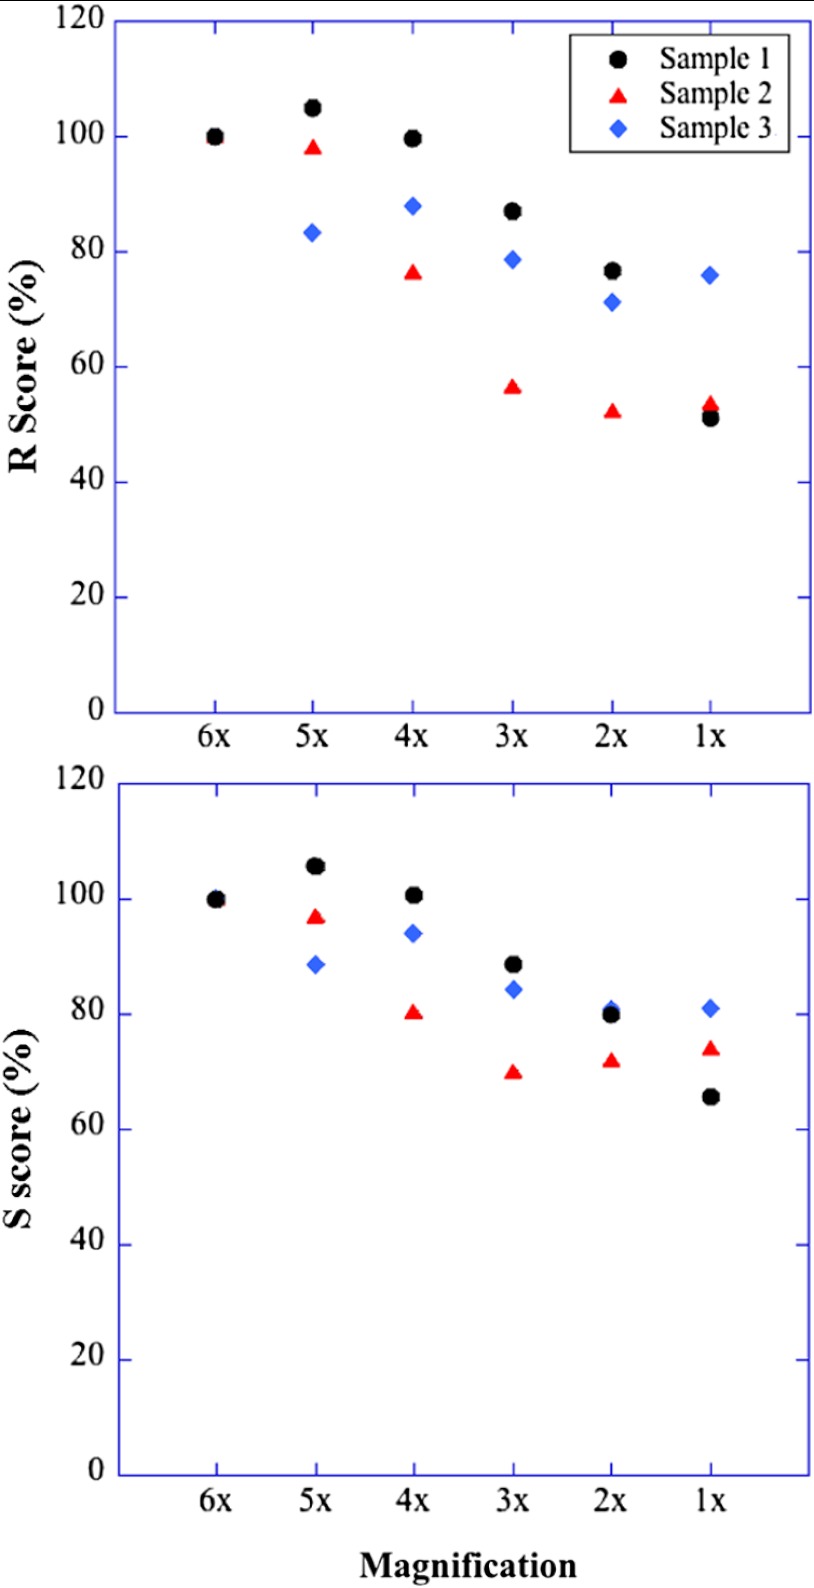
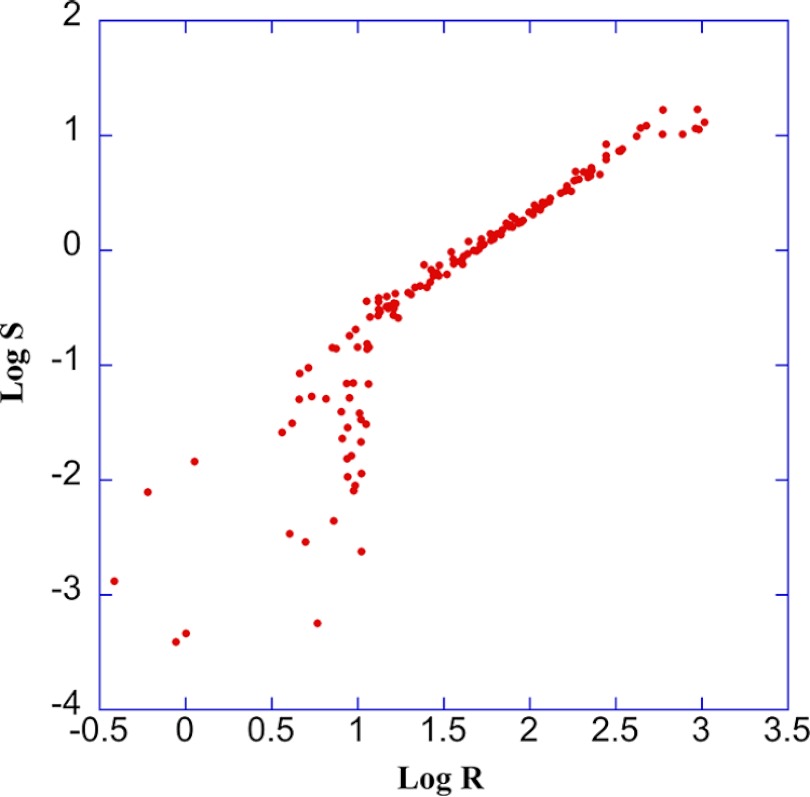
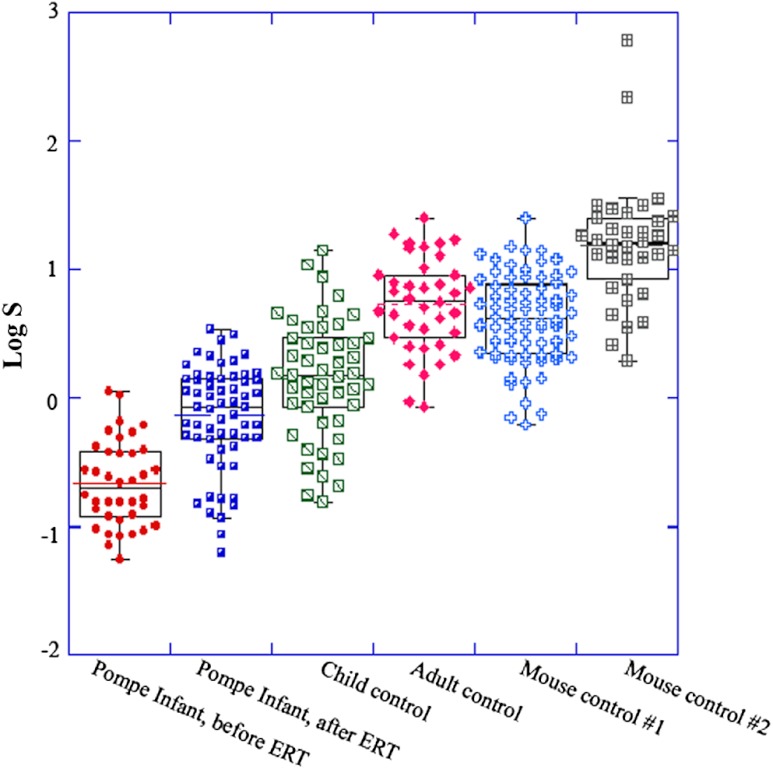
Skeletal muscle pathologies cause irregularities in the normally periodic organization of the myofibrils. Objective grading of muscle morphology is necessary to assess muscle health, compare biopsies, and evaluate treatments and the evolution of disease. To facilitate such quantitation, we have developed a fast, sensitive, automatic imaging analysis software. It detects major and minor morphological changes by combining texture features and Fourier transform (FT) techniques. We apply this tool to second harmonic generation (SHG) images of muscle fibers which visualize the repeating myosin bands. Texture features are then calculated by using a Haralick gray-level cooccurrence matrix in MATLAB. Two scores are retrieved from the texture correlation plot by using FT and curve-fitting methods. The sensitivity of the technique was tested on SHG images of human adult and infant muscle biopsies and of mouse muscle samples. The scores are strongly correlated to muscle fiber condition. We named the software MARS (muscle assessment and rating scores). It is executed automatically and is highly sensitive even to subtle defects. We propose MARS as a powerful and unbiased tool to assess muscle health.
Figures
Similar articles
-
Detection and imaging of non-contractile inclusions and sarcomeric anomalies in skeletal muscle by second harmonic generation combined with two-photon excited fluorescence.J Struct Biol. 2008 Jun;162(3):500-8. doi: 10.1016/j.jsb.2008.03.010. Epub 2008 Apr 8. J Struct Biol. 2008. PMID: 18468456 Free PMC article.
-
Demonstration of flat-top beam illumination in widefield multiphoton microscopy.J Biomed Opt. 2019 Nov;25(1):1-8. doi: 10.1117/1.JBO.25.1.014503. J Biomed Opt. 2019. PMID: 31729201 Free PMC article.
-
Optical clearing for improved contrast in second harmonic generation imaging of skeletal muscle.Biophys J. 2006 Jan 1;90(1):328-39. doi: 10.1529/biophysj.105.066944. Epub 2005 Oct 7. Biophys J. 2006. PMID: 16214853 Free PMC article.
-
Three-dimensional (3D) backward and forward second harmonic generation (SHG) microscopy of biological tissues.J Biophotonics. 2008 Dec;1(6):443-50. doi: 10.1002/jbio.200810060. J Biophotonics. 2008. PMID: 19343670 Review.
-
From molecular structure to tissue architecture: collagen organization probed by SHG microscopy.J Biophotonics. 2013 Feb;6(2):129-42. doi: 10.1002/jbio.201200092. Epub 2012 Jul 12. J Biophotonics. 2013. PMID: 22791562 Review.
Cited by
-
An advanced optical clearing protocol allows label-free detection of tissue necrosis via multiphoton microscopy in injured whole muscle.Theranostics. 2021 Jan 1;11(6):2876-2891. doi: 10.7150/thno.51558. eCollection 2021. Theranostics. 2021. PMID: 33456578 Free PMC article.
-
Skeletal Muscle Tissue Clearing for LacZ and Fluorescent Reporters, and Immunofluorescence Staining.Methods Mol Biol. 2016;1460:129-40. doi: 10.1007/978-1-4939-3810-0_10. Methods Mol Biol. 2016. PMID: 27492170 Free PMC article.
-
Optical prediction of single muscle fiber force production using a combined biomechatronics and second harmonic generation imaging approach.Light Sci Appl. 2018 Oct 24;7:79. doi: 10.1038/s41377-018-0080-3. eCollection 2018. Light Sci Appl. 2018. PMID: 30374401 Free PMC article.
-
Changes in sarcomere lengths of the human vastus lateralis muscle with knee flexion measured using in vivo microendoscopy.J Biomech. 2016 Sep 6;49(13):2989-2994. doi: 10.1016/j.jbiomech.2016.07.013. Epub 2016 Jul 22. J Biomech. 2016. PMID: 27481293 Free PMC article.
-
Resolution and contrast enhancement of subtractive second harmonic generation microscopy with a circularly polarized vortex beam.Sci Rep. 2015 Sep 14;5:13580. doi: 10.1038/srep13580. Sci Rep. 2015. PMID: 26364733 Free PMC article.
References
-
- McComas A. J., Skeletal Muscle: Form and Function, Human Kinetics Publishers, Champaign, IL: (1996).
-
- Scott W., Stevens J., Binder-Macleod S. A., “Human skeletal muscle fiber type classifications,” Phys. Ther. 81(11), 1810–1816 (2001).POTPDY - PubMed
Publication types
MeSH terms
Grants and funding
LinkOut - more resources
Full Text Sources
Other Literature Sources
Miscellaneous
