. 2013 May;12(5):445-51.
doi: 10.1038/nmat3539. Epub 2013 Feb 3.

Compact high-quality CdSe-CdS core-shell nanocrystals with narrow emission linewidths and suppressed blinking

Affiliations

Compact high-quality CdSe-CdS core-shell nanocrystals with narrow emission linewidths and suppressed blinking

Ou Chen et al. Nat Mater. 2013 May.

Abstract

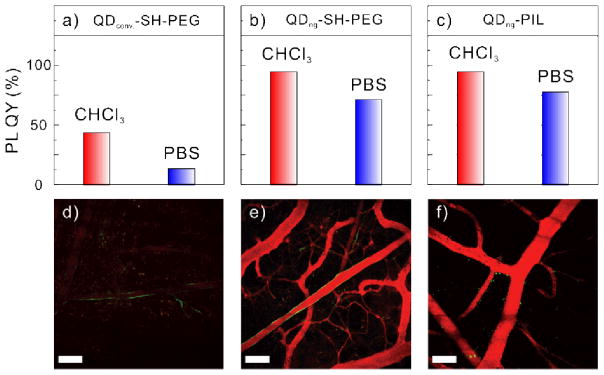
High particle uniformity, high photoluminescence quantum yields, narrow and symmetric emission spectral lineshapes and minimal single-dot emission intermittency (known as blinking) have been recognized as universal requirements for the successful use of colloidal quantum dots in nearly all optical applications. However, synthesizing samples that simultaneously meet all these four criteria has proven challenging. Here, we report the synthesis of such high-quality CdSe-CdS core-shell quantum dots in an optimized process that maintains a slow growth rate of the shell through the use of octanethiol and cadmium oleate as precursors. In contrast with previous observations, single-dot blinking is significantly suppressed with only a relatively thin shell. Furthermore, we demonstrate the elimination of the ensemble luminescence photodarkening that is an intrinsic consequence of quantum dot blinking statistical ageing. Furthermore, the small size and high photoluminescence quantum yields of these novel quantum dots render them superior in vivo imaging agents compared with conventional quantum dots. We anticipate these quantum dots will also result in significant improvement in the performance of quantum dots in other applications such as solid-state lighting and illumination.


Conflict of interest statement

The authors declare no competing financial interests.

Figures

Figure 1
Figure 1. Optical properties of new generation CdSe/CdS core/shell QDs
ad, Absorption (blue) and photoluminescence (PL) (red) spectra of four different CdSe/CdS core/shell QDs synthesized with different CdSe core diameters of a, 2.7 nm, b, 3.4 nm, c, 4.4 nm and d, 5.4 nm. Temporal evolution of e, photoluminescence (PL), f, absorption, g, PL quantum yields (QYs), green square shows the original PL QY of CdSe QDs, and h, full width at half-maximum (FWHM) of the PL peak of the CdSe/CdS core/shell QDs (shown in panel c) during the shell growth reaction.
Figure 2
Figure 2. Morphology, composition and crystal sturcture characterization of new generation QDs
TEM images of a, 4.4 nm CdSe core and bd, CdSe/CdS core/shell QDs with a CdS shell thickness of 0.8nm, 1.6nm and 2.4nm, respectively. e, Energy dispersive X-ray spectrum of the final CdSe/CdS core/shell QDs shown in panel d. Inset shows the observed and calculated atomic percentages of Cd, Se and S atoms. f, X-ray powder diffraction pattern measured from the same sample shown in panel d. The stick patterns show the standard peak positions of bulk wurtzite CdSe (bottom blue sticks) and CdS (top green sticks). The inset shows a representative high-resolution TEM image of a CdSe/CdS QD. Scale bars are 50nm in ad and 2nm in the inset of f.
Figure 3
Figure 3. PL spectral correlation of single and ensemble QDs obtained through S-PCFS
The spectral correlations of the single QD (red line) and the ensemble (blue line) spectrum obtained by S-PCFS for CdSe/CdS core/shell QDs synthesized by a, our method and b conventional method with nearly the same shell thickness (~7MLs).
Figure 4
Figure 4. Blinking behaviour of new generation CdSe/CdS core/shell QDs and ensemble PL stability test
a, Representative PL blinking trace of a single CdSe/CdS core/shell QD with a CdSe core radius of 2.2 nm and a shell thickness of 2.4 nm (~7 MLs) (bin size is 50 ms). Histograms indicate the distribution of intensities observed in the trace. The dashed red line indicates the value chosen as the threshold between “on” and “off” states in calculating the “on” time fraction. b, Histogram of the blinking “on” time fraction. The average “on” time fraction is 0.94 with a standard deviation of ± 0.06. c, Log-log plot of the probability distributions of “on” and “off” times. Straight lines represent a power-law fitting using the equation (Pon/off(ton/off) ∝ tαon/off) where αon = 0.85 for “on” times (red line) and αoff = 2.2 for “off” times (blue line). d, Representative PL blinking trace of a single CdSe/CdS core/shell QD with a CdSe core radius of 2.2 nm and a shell thickness of 0.7 nm (~2 MLs) (bin size is 50 ms). The PL intensity traces obtained from a collection of QDs synthesized through e, our new method and f, the conventional method. The inset in f shows the PL intensity recovery after an initial decay. The black arrow indicates the time point when continuous excitation was stopped.
Figure 5
Figure 5. Water-soluble CdSe/CdS core/shell QDs for in vivo imaging
ac PL QYs of CdSe/CdS core/shell QDs before ligand exchange in chloroform (CHCl3) and after ligand exchange in phosphate buffer saline (PBS 1X, pH 7.4). Equal amount of these QDs (2.5μM, 200μL) were injected retro-orbitally into Tie2-GFP transgenic mice bearing dorsal skinfold chambers, and carried out intravital multiphoton microscopy in the skin at 30 min after injection. a and d: conventional CdSe/CdS QDs synthesized by a literature method and ligand exchanged with methoxy-polyethylene-glycol thiol (QDconv.-SH-PEG). b and e: new generation (ng) CdSe/CdS QDs synthesized by our novel method and ligand exchanged with methoxy-polyethylene-glycol thiol (QDng-SH-PEG). c and f: new generation CdSe/CdS QDs and ligand exchanged with polymeric imidazole ligands (QDng-PIL). In df, all the images are scaled to the same contrast, and scale bars are 100μm.

References

    1. Dahan M, et al. Diffusion dynamics of glycine receptors revealed by single-quantum dot tracking. Science. 2003;302:442–445. - PubMed
    1. Stroh M, et al. Quantum dots spectrally distinguish multiple species within the tumor milieu in vivo. Nat Med. 2005;11:678–682. - PMC - PubMed
    1. Chan WCW, et al. Luminescent quantum dots for multiplexed biological detection and imaging. Curr Opin Biotech. 2002;13:40–46. - PubMed
    1. Jaiswal JK, Simon SM. Potentials and pitfalls of fluorescent quantum dots for biological imaging. Trends Cell Biol. 2004;14:497–504. - PubMed
    1. Colvin VL, Schlamp MC, Alivisatos AP. Light-emitting-diodes made from cadmium selenide nanocrystals and a semiconducting polymer. Nature. 1994;370:354–357.

Publication types