

Surgical volume and center effects on early mortality after pediatric cardiac surgery: 25-year North American experience from a multi-institutional registry
- PMID: 23377381
- PMCID: PMC4357309
- DOI: 10.1007/s00246-013-0633-4
Surgical volume and center effects on early mortality after pediatric cardiac surgery: 25-year North American experience from a multi-institutional registry
Abstract
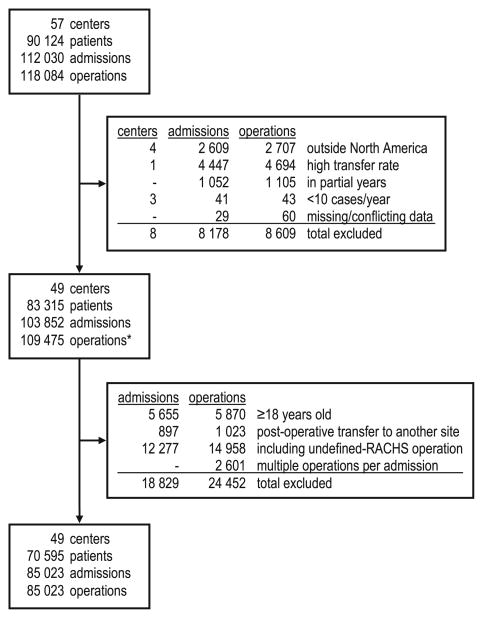
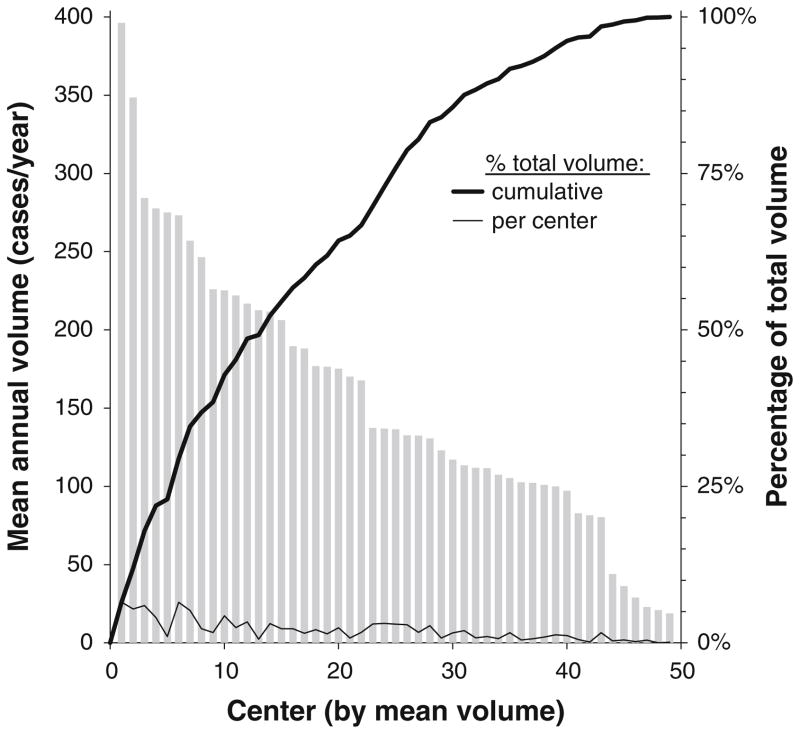
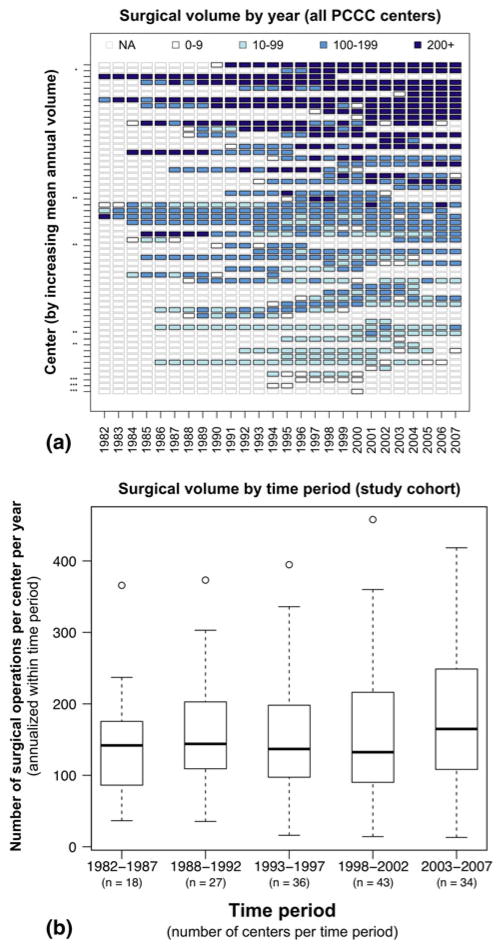
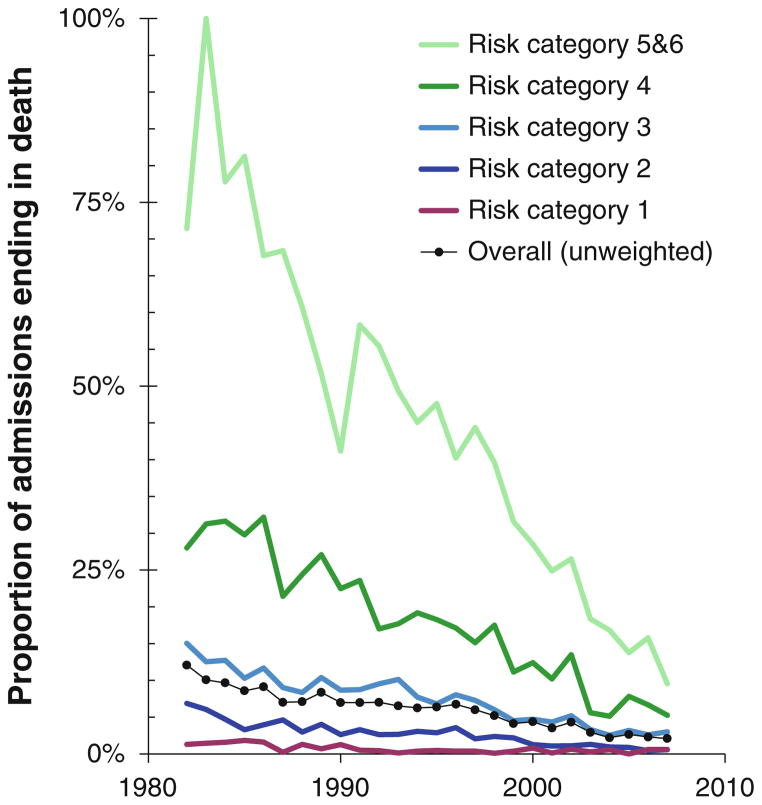
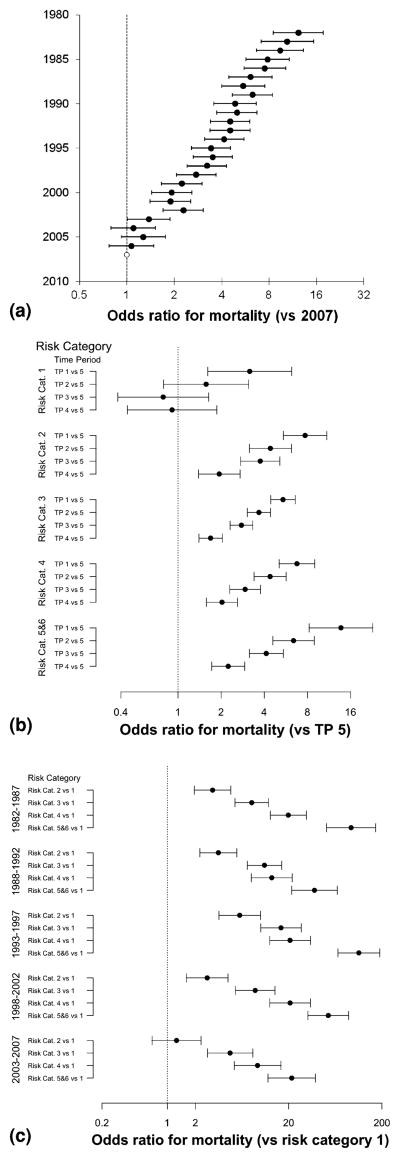
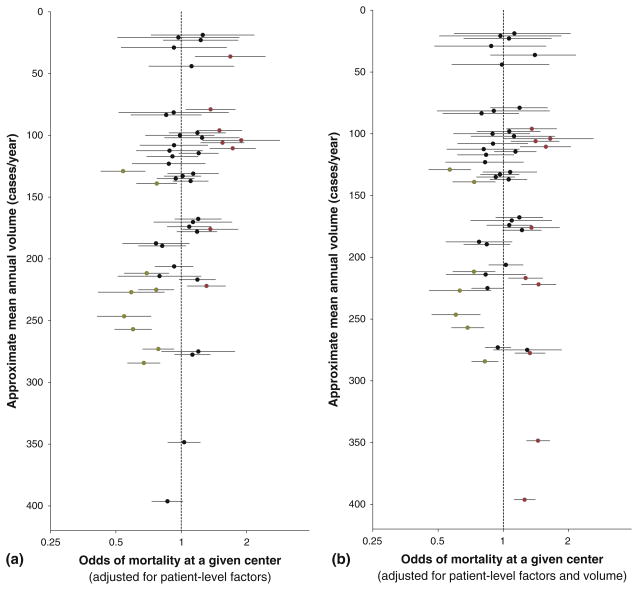
Mortality after pediatric cardiac surgery varies among centers. Previous research suggests that surgical volume is an important predictor of this variation. This report characterizes the relative contribution of patient factors, center surgical volume, and a volume-independent center effect on early postoperative mortality in a retrospective cohort study of North American centers in the Pediatric Cardiac Care Consortium (up to 500 cases/center/year). From 1982 to 2007, 49 centers reported 109,475 operations, 85,023 of which were analyzed using hierarchical multivariate logistic regression analysis. Patient characteristics varied significantly among the centers. The adjusted odds ratio (OR) for mortality decreased more than 10-fold during the study period (1982 vs. 2007: OR, 12.27, 95 % confidence interval [CI], 8.52-17.66; p < 0.0001). Surgical volume was associated inversely with odds of death (additional 100 cases/year: OR, 0.84; 95 % CI, 0.78-0.90; p < 0.0001). In the analysis of interactions, this effect was fairly consistent across age groups, risk categories (except the lowest), and time periods. However, a volume-independent center effect contributed substantially more to the risk model than did the volume. The Risk Adjusted Classification for Congenital Heart Surgery, version 1 (RACHS-1) risk category remains the strongest predictor of postoperative mortality through the 25-year study period. In conclusion, center-specific variation exists but is only partially explained by operative volume. Low-risk operations are safely performed at centers in all volume categories, whereas regionalization or other quality improvement strategies appear to be warranted for moderate- and high-risk operations. Potentially preventable mortality occurs at centers in all volume categories studied, so referral or regionalization strategies must target centers by observed outcomes rather than assume that volume predicts quality.
Figures
References
-
- Allen SW, Gauvreau K, Bloom BT, Jenkins KJ. Evidence-based referral results in significantly reduced mortality after congenital heart surgery. Pediatrics. 2003;112(1 Pt 1):24–28. - PubMed
-
- Chang RK, Klitzner TS. Resources, use, and regionalization of pediatric cardiac services. Curr Opin Cardiol. 2003;18:98–101. - PubMed
-
- Chang RK, Joyce JJ, Castillo J, Ceja J, Quan P, Klitzner TS. Parental preference regarding hospitals for children undergoing surgery: a trade-off between travel distance and potential outcome improvement. Can J Cardiol. 2004;20:877–882. - PubMed
Publication types
MeSH terms
Grants and funding
LinkOut - more resources
Full Text Sources
Other Literature Sources
Medical
