Overview of current methods in sedimentation velocity and sedimentation equilibrium analytical ultracentrifugation
- PMID: 23377850
- PMCID: PMC3652391
- DOI: 10.1002/0471140864.ps2012s71
Overview of current methods in sedimentation velocity and sedimentation equilibrium analytical ultracentrifugation
Abstract
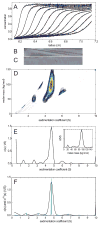
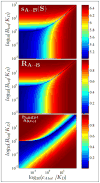
Modern computational strategies have allowed for the direct modeling of the sedimentation process of heterogeneous mixtures, resulting in sedimentation velocity (SV) size-distribution analyses with significantly improved detection limits and strongly enhanced resolution. These advances have transformed the practice of SV, rendering it the primary method of choice for most existing applications of analytical ultracentrifugation (AUC), such as the study of protein self- and hetero-association, the study of membrane proteins, and applications in biotechnology. New global multisignal modeling and mass conservation approaches in SV and sedimentation equilibrium (SE), in conjunction with the effective-particle framework for interpreting the sedimentation boundary structure of interacting systems, as well as tools for explicit modeling of the reaction/diffusion/sedimentation equations to experimental data, have led to more robust and more powerful strategies for the study of reversible protein interactions and multiprotein complexes. Furthermore, modern mathematical modeling capabilities have allowed for a detailed description of many experimental aspects of the acquired data, thus enabling novel experimental opportunities, with important implications for both sample preparation and data acquisition. The goal of the current unit is to describe the current tools for the study of soluble proteins, detergent-solubilized membrane proteins and their interactions by SV and SE.
Figures


Similar articles
-
Analytical Ultracentrifugation as a Tool for Studying Protein Interactions.Biophys Rev. 2013 Jun 1;5(2):159-171. doi: 10.1007/s12551-013-0106-2. Biophys Rev. 2013. PMID: 23682298 Free PMC article.
-
On the analysis of protein self-association by sedimentation velocity analytical ultracentrifugation.Anal Biochem. 2003 Sep 1;320(1):104-24. doi: 10.1016/s0003-2697(03)00289-6. Anal Biochem. 2003. PMID: 12895474
-
Characterizing protein-protein interactions by sedimentation velocity analytical ultracentrifugation.Curr Protoc Immunol. 2008 May;Chapter 18:18.15.1-18.15.39. doi: 10.1002/0471142735.im1815s81. Curr Protoc Immunol. 2008. PMID: 18491296
-
Modern analytical ultracentrifugation in protein science: a tutorial review.Protein Sci. 2002 Sep;11(9):2067-79. doi: 10.1110/ps.0207702. Protein Sci. 2002. PMID: 12192063 Free PMC article. Review.
-
Using Lamm-Equation modeling of sedimentation velocity data to determine the kinetic and thermodynamic properties of macromolecular interactions.Methods. 2011 May;54(1):4-15. doi: 10.1016/j.ymeth.2010.12.029. Epub 2010 Dec 25. Methods. 2011. PMID: 21187153 Free PMC article. Review.
Cited by
-
Small Molecule Sequestration of the Intrinsically Disordered Protein, p27Kip1, Within Soluble Oligomers.J Mol Biol. 2021 Sep 3;433(18):167120. doi: 10.1016/j.jmb.2021.167120. Epub 2021 Jun 29. J Mol Biol. 2021. PMID: 34197833 Free PMC article.
-
Architectural basis for cylindrical self-assembly governing Plk4-mediated centriole duplication in human cells.Commun Biol. 2023 Jul 11;6(1):712. doi: 10.1038/s42003-023-05067-8. Commun Biol. 2023. PMID: 37433832 Free PMC article.
-
Biointeractions of ultrasmall glutathione-coated gold nanoparticles: effect of small size variations.Nanoscale. 2016 Mar 28;8(12):6577-88. doi: 10.1039/c5nr07642k. Nanoscale. 2016. PMID: 26934984 Free PMC article.
-
Nucleic acid-induced dimerization of HIV-1 Gag protein.J Biol Chem. 2019 Nov 8;294(45):16480-16493. doi: 10.1074/jbc.RA119.010580. Epub 2019 Sep 30. J Biol Chem. 2019. PMID: 31570521 Free PMC article.
-
HIV-1 vif mediates ubiquitination of the proximal protomer in the APOBEC3H dimer to induce degradation.Nat Commun. 2025 Jul 1;16(1):5879. doi: 10.1038/s41467-025-60984-y. Nat Commun. 2025. PMID: 40593686 Free PMC article.
References
-
- Ansevin AT, Roark DE, Yphantis DA. Improved ultracentrifuge cells for high-speed sedimentation equilibrium studies with interference optics. Anal Biochem. 1970;34:237–261. - PubMed
-
- Balbo A, Brown PH, Schuck P. Experimental protocol for sedimentation equilibrium analytical ultracentrifugation. 2007.
Publication types
MeSH terms
Substances
Grants and funding
LinkOut - more resources
Full Text Sources
Other Literature Sources

