

Response of bone marrow derived connective tissue progenitor cell morphology and proliferation on geometrically modulated microtextured substrates
- PMID: 23378044
- PMCID: PMC3796580
- DOI: 10.1007/s10544-012-9727-7
Response of bone marrow derived connective tissue progenitor cell morphology and proliferation on geometrically modulated microtextured substrates
Abstract
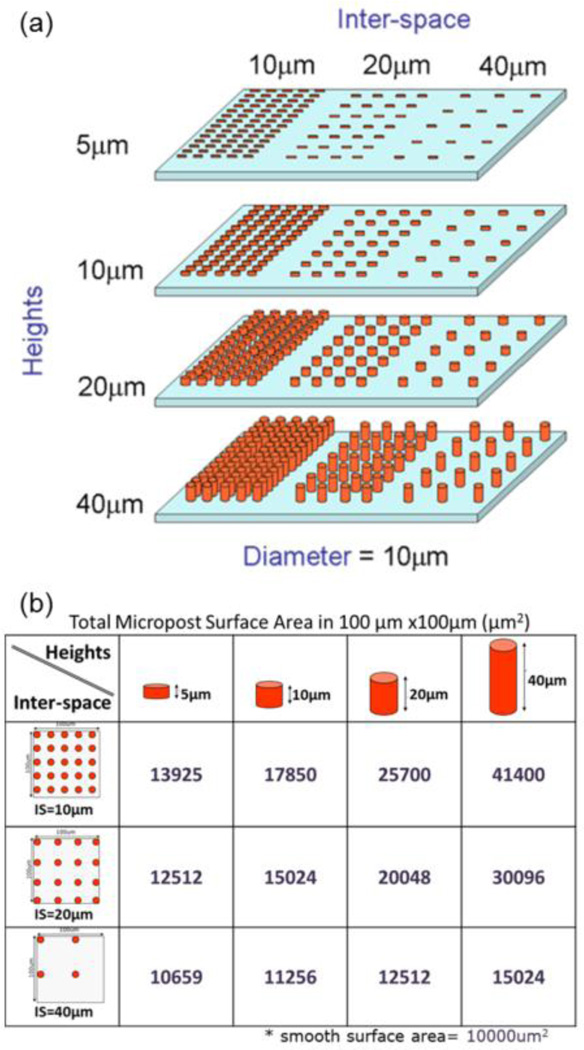
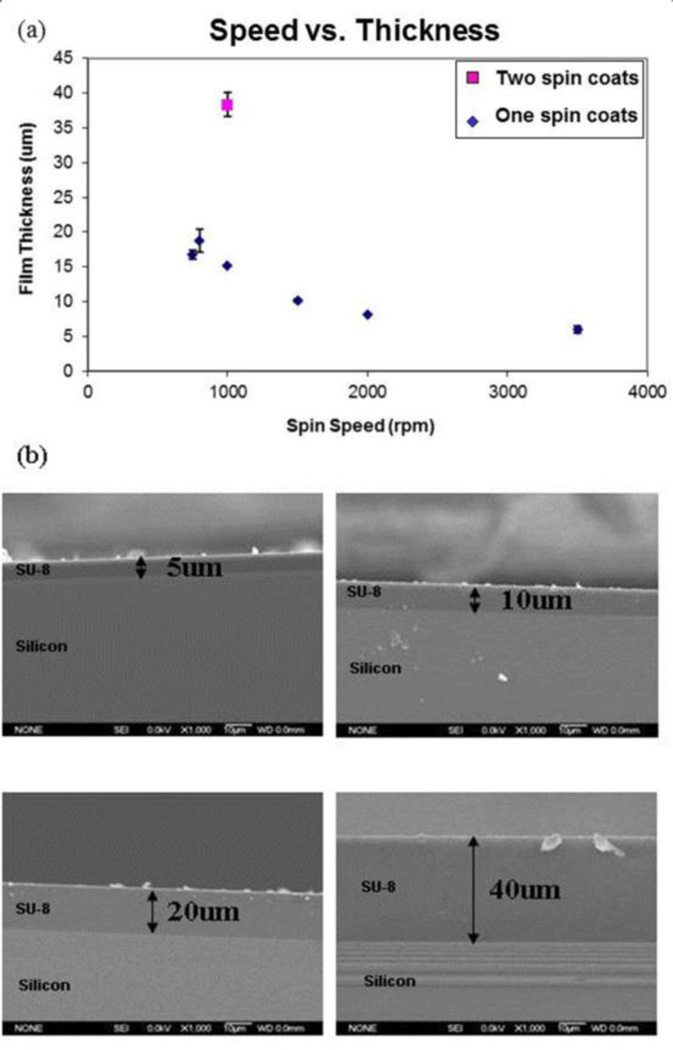
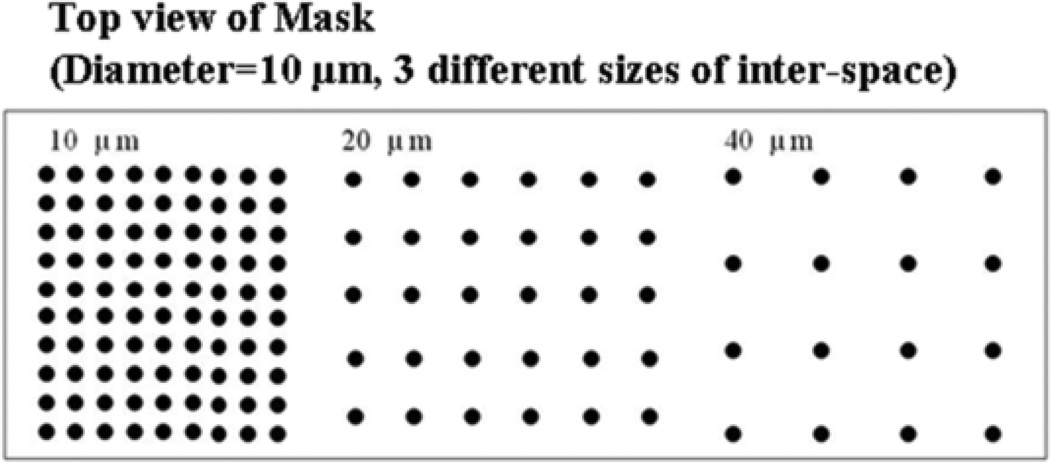
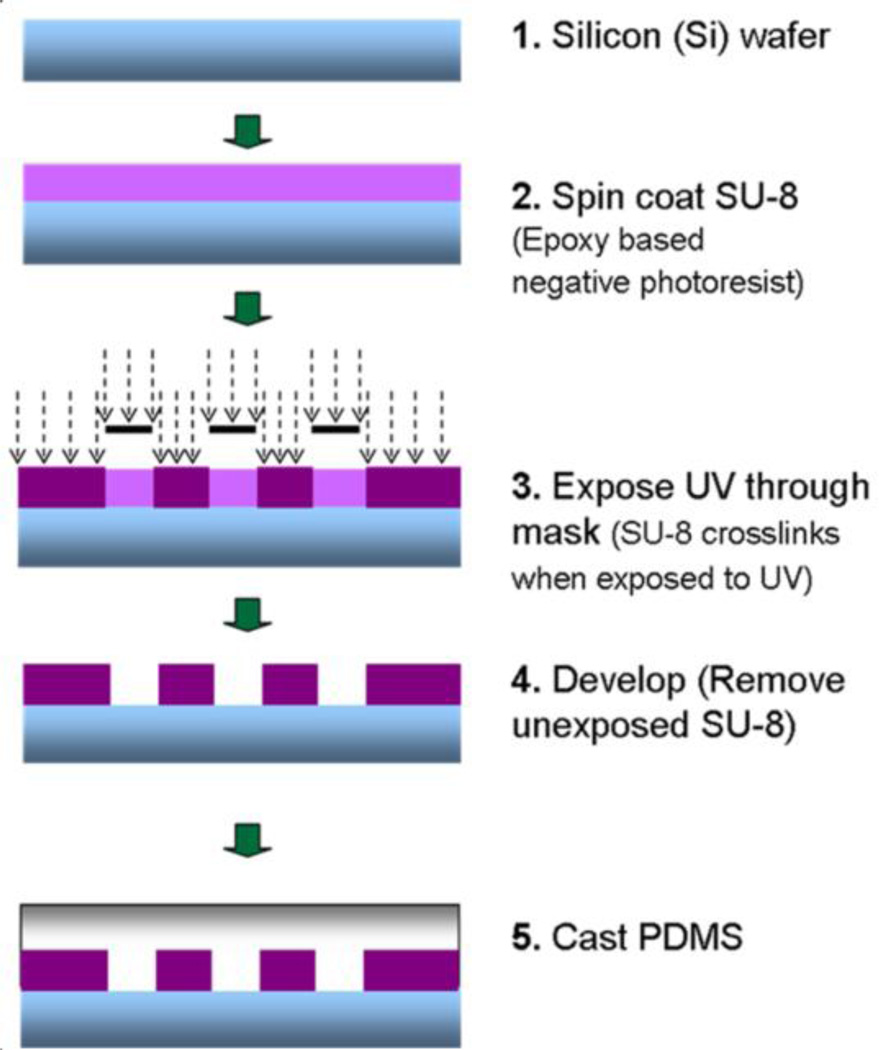
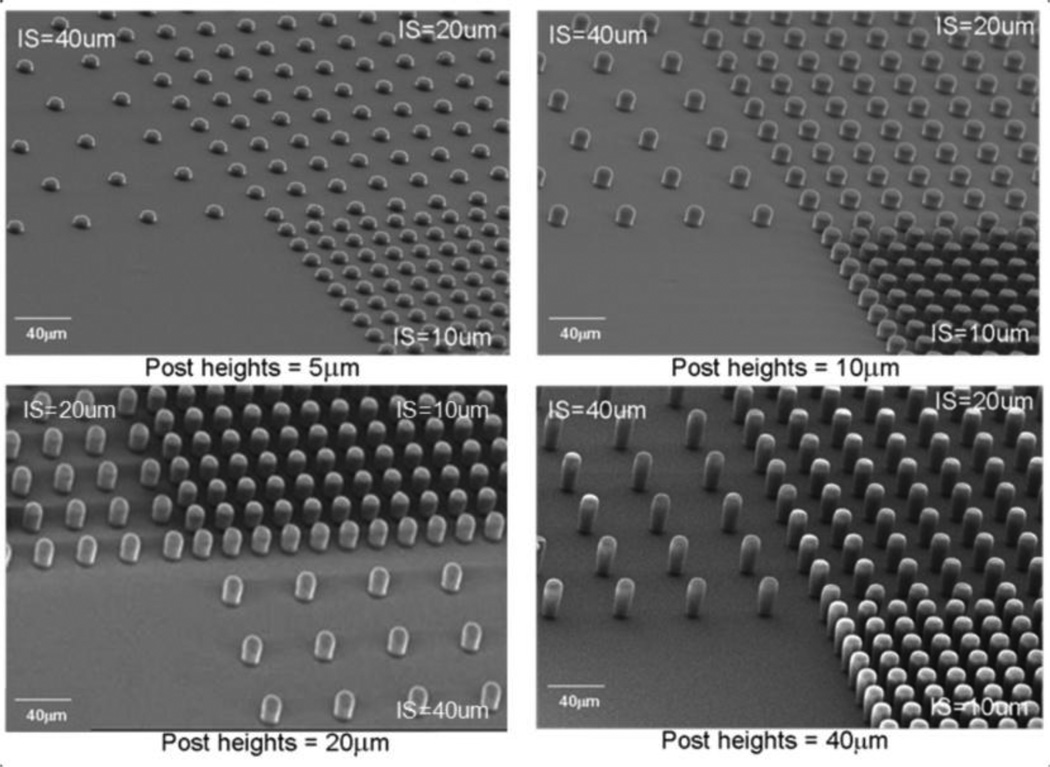
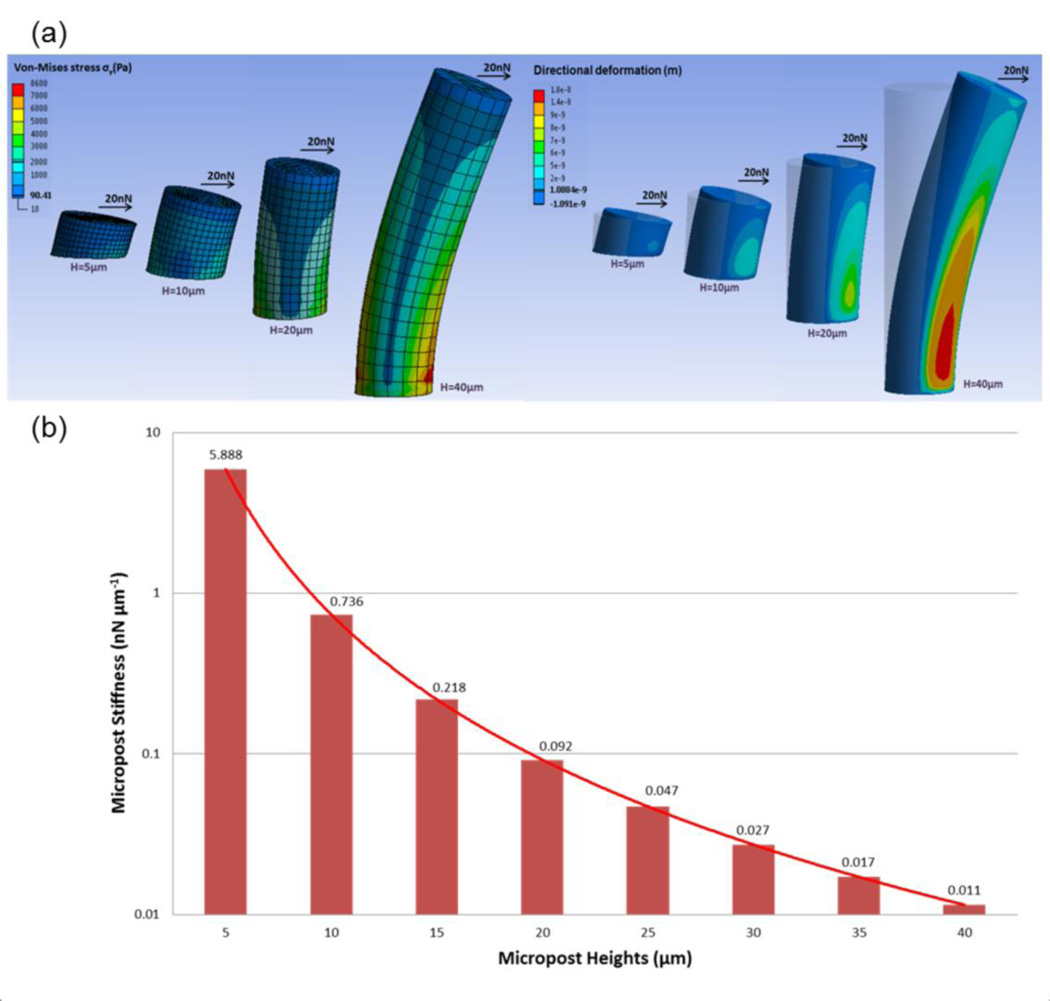
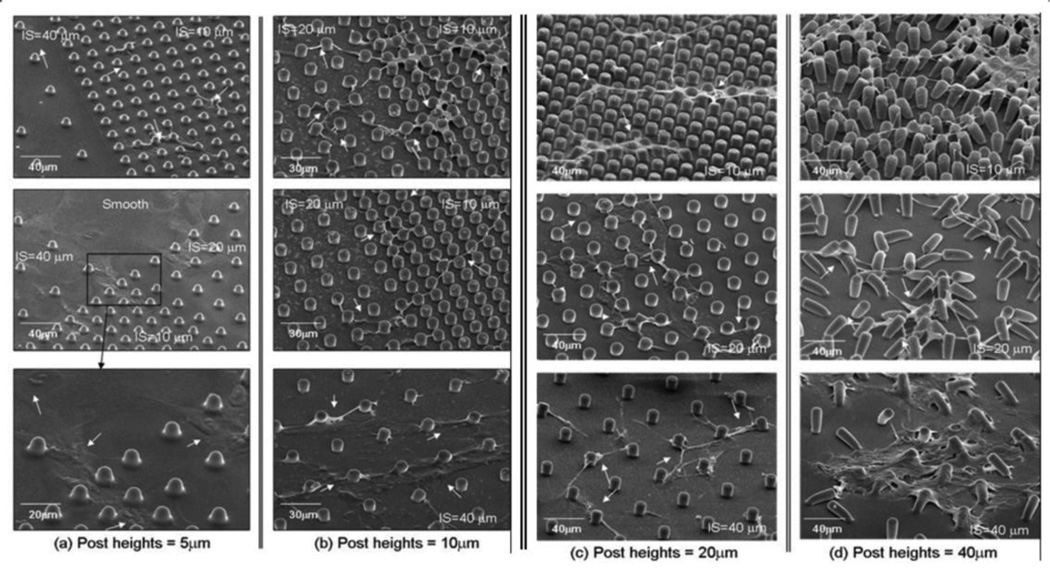
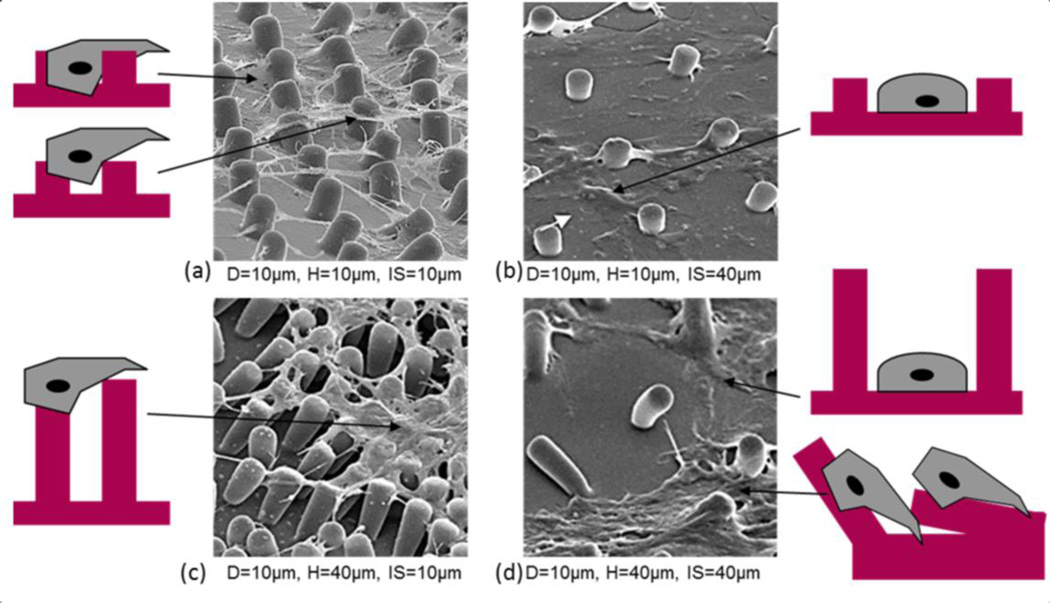
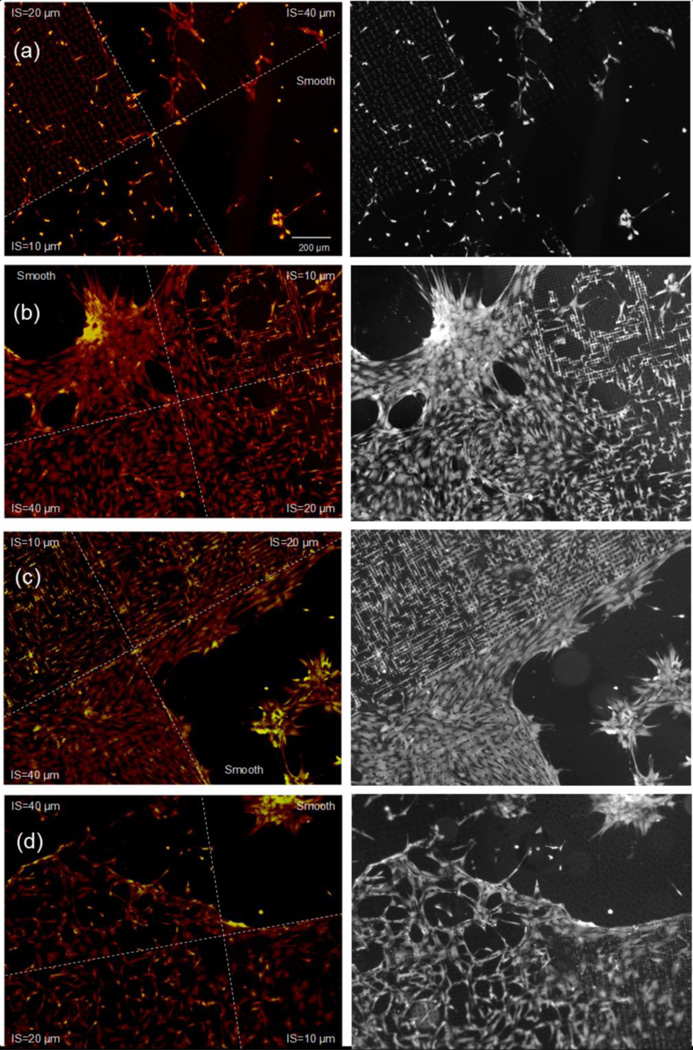
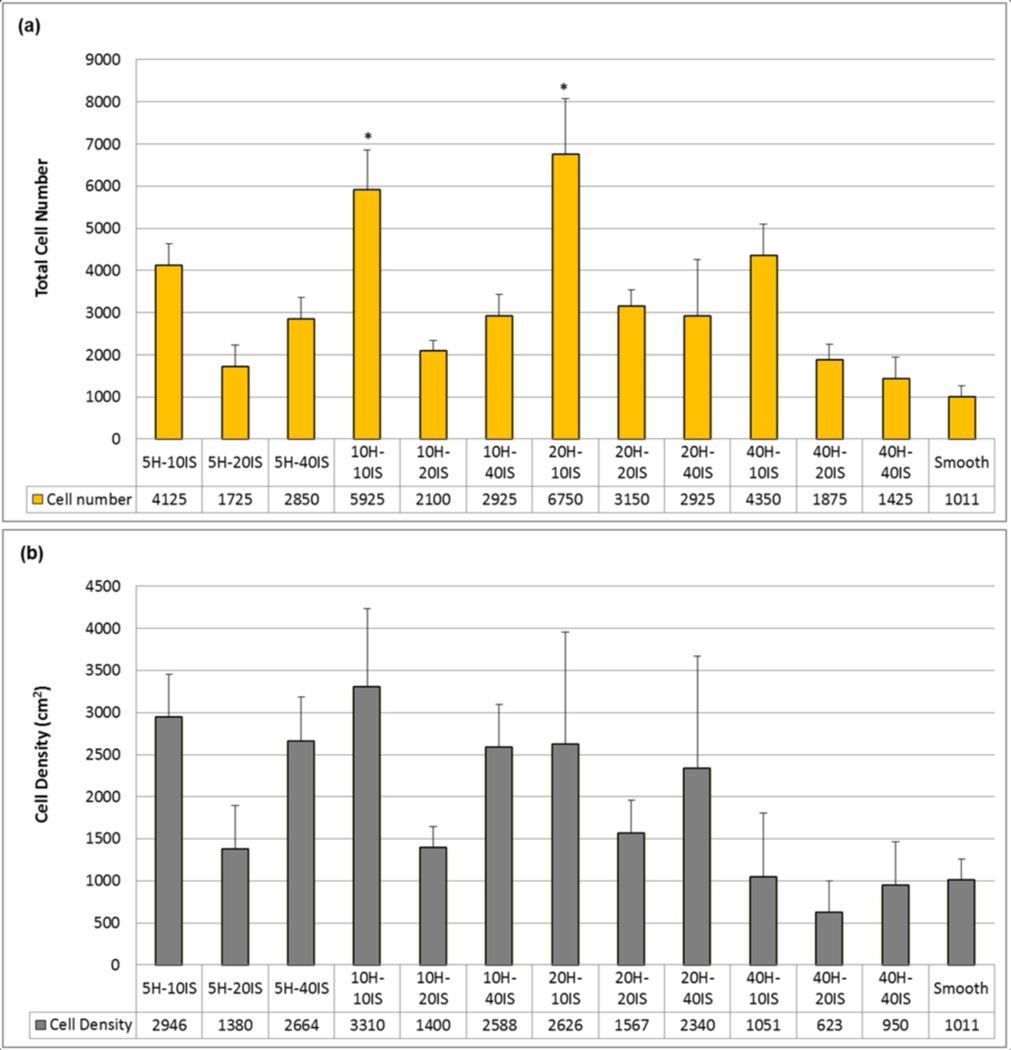
Varying geometry and layout of microposts on a cell culture substrate provides an effective technique for applying mechanical stimuli to living cells. In the current study, the optimal geometry and arrangement of microposts on the polydimethylsiloxane (PDMS) surfaces to enhance cell growth behavior were investigated. Human bone marrow derived connective tissue progenitor cells were cultured on PDMS substrates comprising unpatterned smooth surfaces and cylindrical post microtextures that were 10 μm in diameter, 4 heights (5, 10, 20 and 40 μm) and 3 pitches (10, 20, and 40 μm). With the same 10 μm diameter, post heights ranging from 5 to 40 μm resulted in a more than 535 fold range of rigidity from 0.011 nNμm⁻¹ (40 μm height) up to 5.888 nNμm⁻¹(5 μm height). Even though shorter microposts result in higher effective stiffness, decreasing post heights below the optimal value, 5 μm height micropost in this study decreased cell growth behavior. The maximum number of cells was observed on the post microtextures with 20 μm height and 10 μm inter-space, which exhibited a 675 % increase relative to the smooth surfaces. The cells on all heights of post microtextures with 10 μm and 20 μm inter-spaces exhibited highly contoured morphology. Elucidating the cellular response to various external geometry cues enables us to better predict and control cellular behavior. In addition, knowledge of cell response to surface stimuli could lead to the incorporation of specific size post microtextures into surfaces of implants to achieve surface-textured scaffold materials for tissue engineering applications.
Figures
Similar articles
-
Post microtextures accelerate cell proliferation and osteogenesis.Acta Biomater. 2010 Jan;6(1):160-9. doi: 10.1016/j.actbio.2009.06.016. Epub 2009 Jun 16. Acta Biomater. 2010. PMID: 19539062 Free PMC article.
-
Growth of connective tissue progenitor cells on microtextured polydimethylsiloxane surfaces.J Biomed Mater Res. 2002 Dec 15;62(4):499-506. doi: 10.1002/jbm.10353. J Biomed Mater Res. 2002. PMID: 12221697
-
Micropattern array with gradient size (µPAGS) plastic surfaces fabricated by PDMS (polydimethylsiloxane) mold-based hot embossing technique for investigation of cell-surface interaction.Biofabrication. 2012 Dec;4(4):045006. doi: 10.1088/1758-5082/4/4/045006. Epub 2012 Oct 17. Biofabrication. 2012. PMID: 23075468
-
Engineering principles of clinical cell-based tissue engineering.J Bone Joint Surg Am. 2004 Jul;86(7):1541-58. doi: 10.2106/00004623-200407000-00029. J Bone Joint Surg Am. 2004. PMID: 15252108 Review.
-
Tribological Effects of Surface Biomimetic Micro-Nano Textures on Metal Cutting Tools: A Review.Biomimetics (Basel). 2025 May 1;10(5):283. doi: 10.3390/biomimetics10050283. Biomimetics (Basel). 2025. PMID: 40422112 Free PMC article. Review.
Cited by
-
(De)form and Function: Measuring Cellular Forces with Deformable Materials and Deformable Structures.Adv Healthc Mater. 2020 Apr;9(8):e1901454. doi: 10.1002/adhm.201901454. Epub 2020 Jan 17. Adv Healthc Mater. 2020. PMID: 31951099 Free PMC article. Review.
-
Increased osteoblast function in vitro and in vivo through surface nanostructuring by ultrasonic shot peening.Int J Nanomedicine. 2015 Jul 20;10:4593-603. doi: 10.2147/IJN.S83788. eCollection 2015. Int J Nanomedicine. 2015. PMID: 26229463 Free PMC article.
-
Conductive gradient hydrogels allow spatial control of adult stem cell fate.J Mater Chem B. 2024 Feb 14;12(7):1854-1863. doi: 10.1039/d3tb02269b. J Mater Chem B. 2024. PMID: 38291979 Free PMC article.
References
-
- Boyan B, Batzer R, Kieswetter K, Liu Y, Cochran D, Szmuckler-Moncler S, Dean D, Schwartz Z. J. Biomed. Mater. Res. 1998;39:77. - PubMed
-
- Boyan B, Lohmann C, Sisk M, Liu Y, Sylvia V, Cochran D, Dean D, Schwartz Z. J. Biomed. Mate.r Res. 2001;55:350. - PubMed
-
- Chen C, Jiang X, Whitesides G. MRS Bulletin. 2005;30:194.
-
- Dalby M, Gadegaard N, Tare R, Andar A, Riehle M, Herzyk P, Wilkinson C, Oreffo R. Nat. Mater. 2007;6:997. - PubMed
MeSH terms
Substances
Grants and funding
LinkOut - more resources
Full Text Sources
Other Literature Sources
Medical
