. 2013 May;31(5):882-94.
doi: 10.1002/stem.1345.

Lmo2 induces hematopoietic stem cell-like features in T-cell progenitor cells prior to leukemia

Affiliations

Lmo2 induces hematopoietic stem cell-like features in T-cell progenitor cells prior to leukemia

Susan M Cleveland et al. Stem Cells. 2013 May.

Abstract

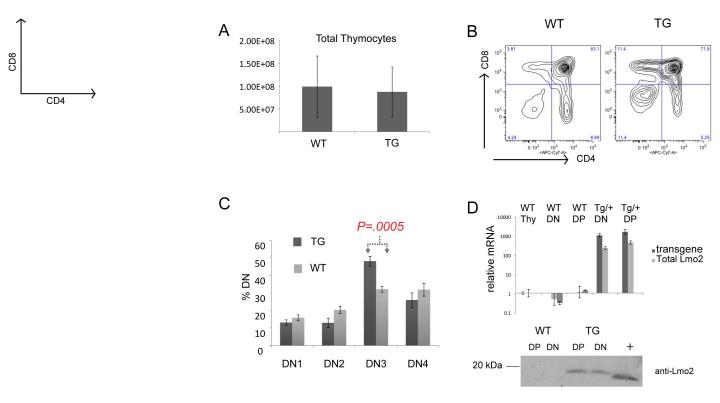
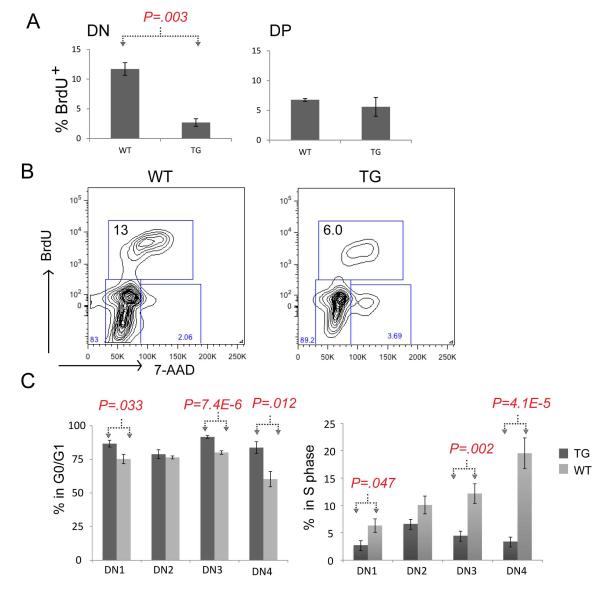
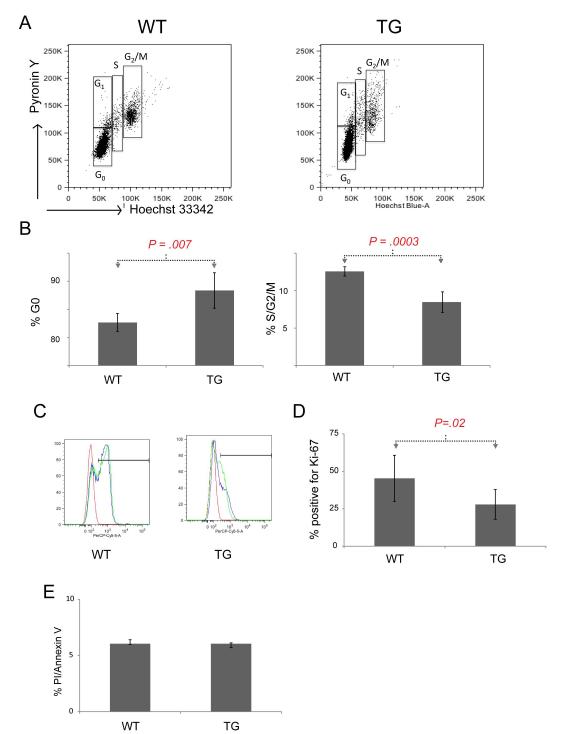
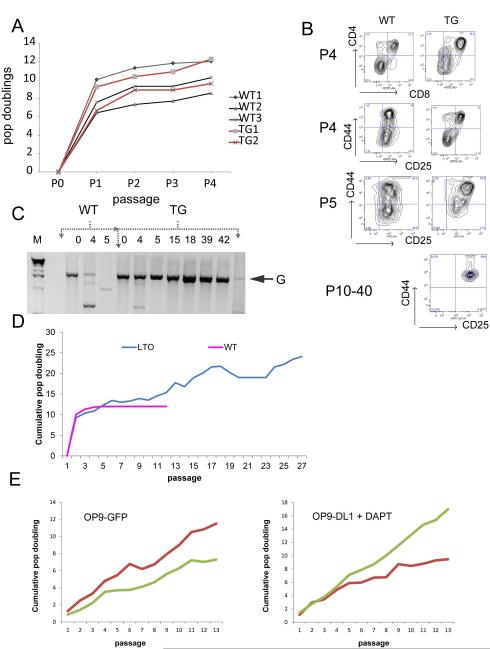
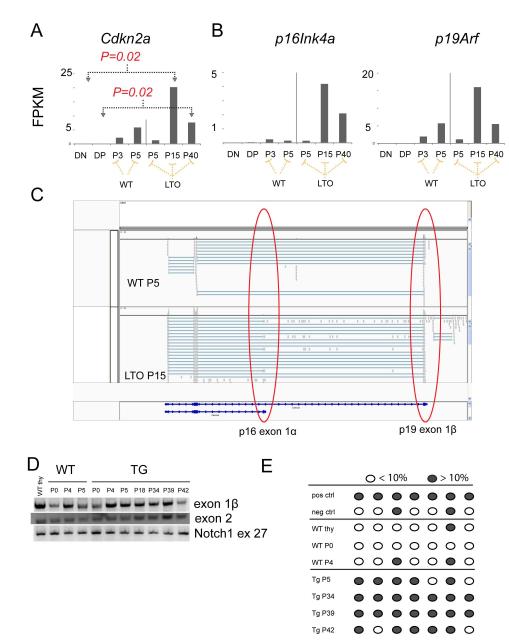
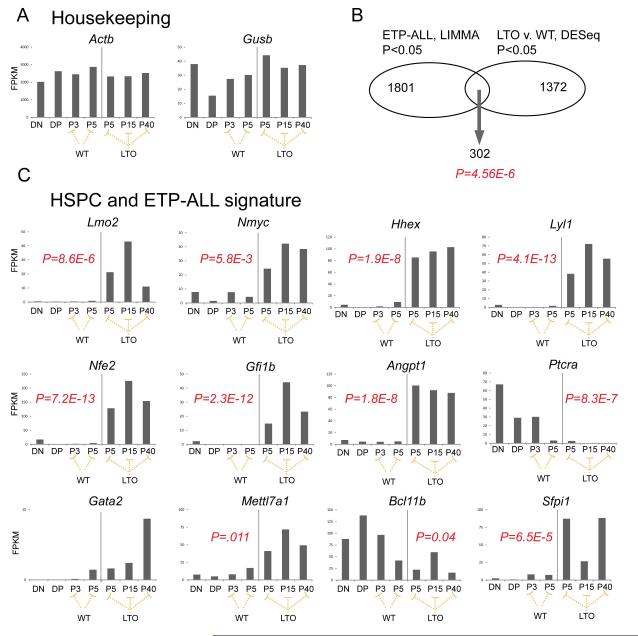
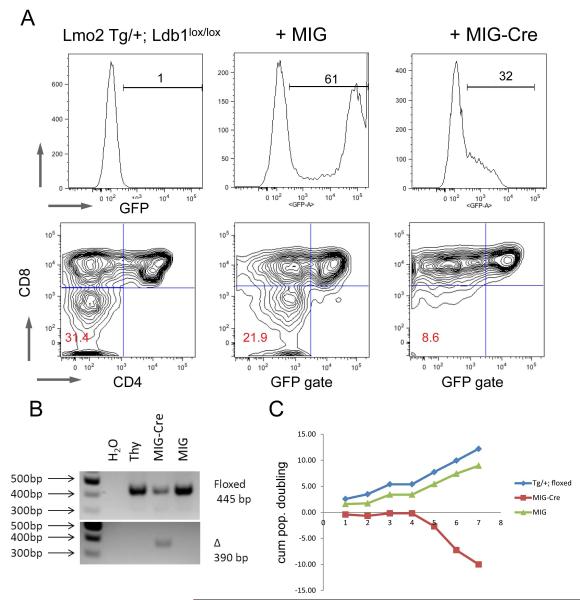
LIM domain only 2 (Lmo2) is frequently deregulated in sporadic and gene therapy-induced acute T-cell lymphoblastic leukemia (T-ALL) where its overexpression is an important initiating mutational event. In transgenic and retroviral mouse models, Lmo2 expression can be enforced in multiple hematopoietic lineages but leukemia only arises from T cells. These data suggest that Lmo2 confers clonal growth advantage in T-cell progenitors. We analyzed proliferation, differentiation, and cell death in CD2-Lmo2 transgenic thymic progenitor cells to understand the cellular effects of enforced Lmo2 expression. Most impressively, Lmo2 transgenic T-cell progenitor cells were blocked in differentiation, quiescent, and immortalized in vitro on OP9-DL1 stromal cells. These cellular effects were concordant with a transcriptional signature in Lmo2 transgenic T-cell progenitor cells that is also present in hematopoietic stem cells (HSCs) and early T-cell precursor ALL. These results are significant in light of the crucial role of Lmo2 in the maintenance of the HSC. The cellular effects and transcriptional effects have implications for LMO2-dependent leukemogenesis and the treatment of LMO2-induced T-ALL.


Figures

Figure 1
Figure 1. Lmo2 transgenic mice show increased T-cell progenitors at DN3 stage
(A) bar graph shows counts from WT (n=8) and CD2-Lmo2 transgenic (TG, n=6) thymocytes with S.D. shown with error bars. (B) shows representative contour plots of WT and TG thymi stained for CD4 and CD8. (C) WT (n=8) and TG (n=9) thymocyte double negative thymocytes were subtyped for DN1-4 by CD44 and CD25 staining; percentage of each is shown. P value is from two-tailed Student t-test. (D) graph shows qRT-PCR for Lmo2, total and transgenic. Bottom panel shows a western blot of whole protein lysate from TG or WT DN or DP thymocytes probed with anti-Lmo2 antibody; “+” denotes 293T lysate transfected with an Lmo2 expression plasmid. Error bars show the SD.
Figure 2
Figure 2. Lmo2 transgenic T-cell progenitors have decreased BrdU uptake
(A) Bar graphs show the percentage of cells staining with anti-BrdU antibody after in vivo labeling of WT (n=4) and TG (n=5) mice. P value is a result of Student t-test; DN, double negative; DP, double positive thymocytes were electronically gated. (B) shows representative FACS contour plot of in vivo BrdU labeling of DN (electronically gated) thymocytes from WT and TG mice; y-axis is anti-BrdU and x-axis shows 7-AAD staining. Box shows the proportion of cells in S phase in these WT and TG mice. (C) Bar graph shows the mean percentage of DN1-4 subsets in G0/G1 (left panel) or in S-phase. Dark gray denotes TG (n=9) T-cell progenitors and light gray denotes WT (n=8); error bars show the SD. Brackets and P values show two-tailed Student t-test analysis.
Figure 3
Figure 3. Lmo2 transgenic T-cell progenitors are quiescent
(A) representative FACS plots for DN thymocytes isolated from TG or WT mice stained for pyronin Y (y-axis) or Hoechst are shown. Boxes denote cell cycle phases. (B) Bar graph shows the mean of cell cycle phases for TG (n=5) and WT (n=5) DN thymocytes in G0 (left panel) or in combined S/G2/M phases (right panel). Error bars show the SD. Brackets and P values are from two tailed Student t-test analysis. (C) A representative FACS plot shows the staining of TG and WT DN thymocytes with anti-Ki67 antibody. The bar shows positive staining. Red curve is isotype control; blue and green are specific antibody. (D) Bar graph shows the mean percentage of DN thymocytes staining positive for Ki-67 antigen in TG (n=10) and WT (n=6) mice. (E) Bar graph shows the mean proportion of positive cells in TG and WT. Error bars show the SD. Bracket and P value are from two-tailed Student t-test analysis.
Figure 4
Figure 4. In vitro T-cell differentiation recapitulates differentiation block and immortalizes Lmo2 expressing T-cell progenitors
(A) Graph shows population doublings versus passage number for WT and TG LSK cells plated on irradiated OP9-DL1 stromal cell line. (B) These representative FACS contour plots show the appearance of WT and TG T cells arising in OP9-DL1 culture at various passages (P). Top panel shows CD4/CD8 staining; DN cells were electronically gated as CD4CD8 and assayed for CD44 and CD25. WT T-cell progenitors could not be recovered for staining beyond P5. TG lines that were immortalized and termed LTOs resembled DN2 cells as shown for P10-40. (C) Agarose gel shows PCR of Jβ2 region from gDNA derived from WT or TG T cells on OP9-DL1 cultures. Column numbers show the passage number. G denotes 2 kb germline band. (D) Line graph shows the cumulative population doublings versus passage number for WT and TG (LTO) T cells growing on OP9-DL1. The graph is representative of 4 independent experiments where TG cells immortalized. (E) Late passage LTOs were plated on to OP9-GFP stromal line or OP9-DL1 cells in the presence of 10 μM DAPT. Y-axis shows cumulative population doublings and x-axis shows passage number.
Figure 5
Figure 5. Lmo2 expressing T-cell progenitors deregulate Cdkn2a expression concordant with immortalization
(A) Bar graphs show the normalized quantification of total Cdkn2a transcripts in FPKM (fragments per kilobase per million reads) for DN and DP thymocytes from WT mice; passage 3 and 5 of WT T cells in OP9-DL1 culture; and, passages 5, 15, and 40 of TG T-cell progenitors. P values are from comparisons of bracketed values and are corrected for multiple hypothesis testing. FPKMs for p16Ink4a and p19Arf are shown for the same samples. P values were not statistically significant and are not shown. (C) This schematic is a snapshot of the Integrated Genome Viewer (IGV) that shows WT P5 and TG (LTO) P15 RNA-seq reads. The red circles show the exon 1β of p19 and exon 1α of p16. The latter was only found in the LTO samples. (D) Agarose gel shows PCR of gDNA for exon 1β, exon 2 of Cdkn2a and of exon 27 of Notch1. Numbers denote passage number for WT and TG cells. (E) Schematic shows analysis of CpGs in the promoter of p16 analyzed by PCR of bisulfite-converted gDNA from WT or TG T cells from various passages. Dark gray circles show greater than 10% methylation whereas open circles show less than 10% methylation as analyzed by pyrosequencing.
Figure 6
Figure 6. Lmo2 expressing T-cell progenitors show a transcriptional profile of genes important in HSPC and ETP-ALL
(A) Bar graph show RNA-seq analysis of DN and DP cells from WT mice; WT T cells from passages 3 and 5; and, TG (LTO) T cells from passages 5, 15, and 40. FPKMs are normalized read counts from sequencing. Housekeeping genes are shown. (B) Venn diagram denotes the overlap between two datasets: LIMMA analysis of ETP-ALL versus non-ETP-ALL patients; number of genes with raw P <0.05 are shown; the right circle shows the dataset generated from DESeq differential gene expression between LTO versus WT T cells growing on OP9-DL1. As shown 302 genes were present in the overlap, a highly significant result; P value was generated from Fisher exact test and confirmed independently by permutation analysis. (C) Bar graphs show FPKMs for several representative genes differentially expressed between LTO and WT T cells by RNA-seq analysis. P values are generated from DESeq application and are corrected for multiple hypothesis testing.
Figure 7
Figure 7. Lmo2 requires Ldb1 to induce and maintain DN progenitors
(A) DN thymocytes were sorted from TG/+; Ldb1lox/lox mice and transduced with MIG or MIG-Cre retroviruses and plated on OP9-DL1 and passaged weekly; FACS plots in the top panel show the proportion of cells positive for GFP emission in the three groups. Bottom panel shows FACS contour plots of CD4 and CD8 staining. Red numbers show the proportion of cells in the DN quadrant. (B) Agarose gel of gDNA PCR from the same experiment shown in (A) shows floxed and deleted amplicons. (C) shows a line graph of cumulative population doublings (y-axis) of GFP+ cells in culture versus passage number (x-axis). Blue shows untransduced TG thymocytes; green line shows MIG transduced; and, red line shows MIG-Cre transduced cells. The FACS plots are representative of three independent transductions.

References

    1. Armstrong SA, Look AT. Molecular genetics of acute lymphoblastic leukemia. J Clin Oncol. 2005;23:6306–6315. - PubMed
    1. Nam CH, Rabbitts TH. The role of LMO2 in development and in T cell leukemia after chromosomal translocation or retroviral insertion. Mol Ther. 2006;13:15–25. - PubMed
    1. P., Beverloo H, Buijs-Gladdines J, et al. Monoallelic or biallelic LMO2 expression in relation to the LMO2 rearrangement status in pediatric T-cell acute lymphoblastic leukemia. Leukemia. 2007;22:1434–1437. - PubMed
    1. Van Vlierberghe P, Beverloo H, Buijs-Gladdines J, et al. Monoallelic or biallelic LMO2 expression in relation to the LMO2 rearrangement status in pediatric T-cell acute lymphoblastic leukemia. Leukemia. 2007;22:1434–1437. - PubMed
    1. Van Vlierberghe P, van Grotel M, Beverloo HB, et al. The cryptic chromosomal deletion del(11)(p12p13) as a new activation mechanism of LMO2 in pediatric T-cell acute lymphoblastic leukemia. Blood. 2006;108:3520–3529. - PubMed

Publication types

MeSH terms

Substances