. 2013 Mar 15;190(6):2747-55.
doi: 10.4049/jimmunol.1202185. Epub 2013 Feb 1.

Evidence for postinitiation regulation of mRNA biogenesis in tuberculosis

Affiliations

Evidence for postinitiation regulation of mRNA biogenesis in tuberculosis

Hugh Salamon et al. J Immunol. .

Abstract

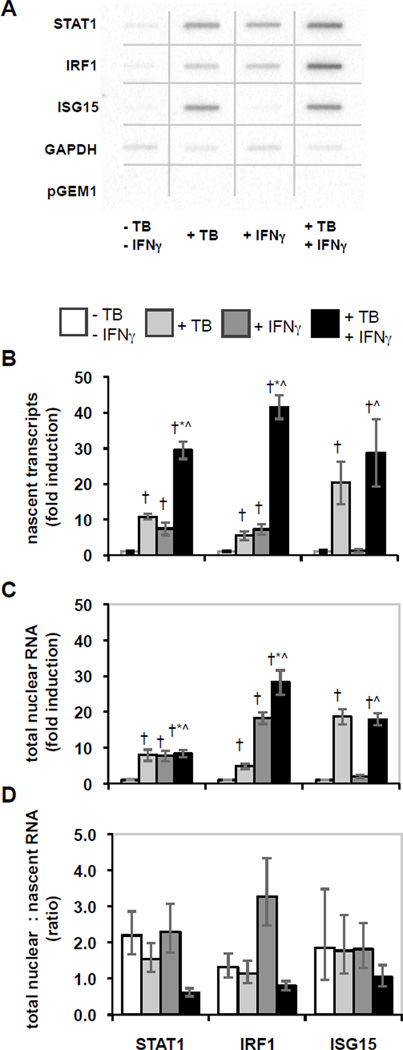
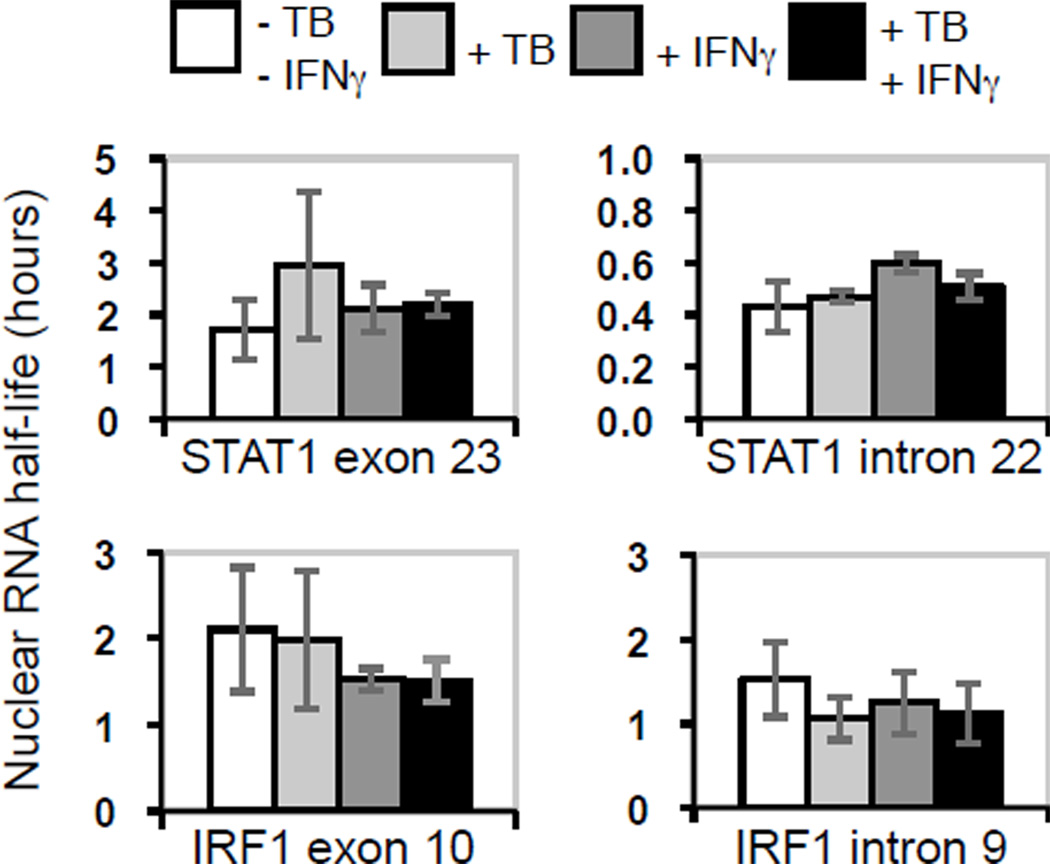
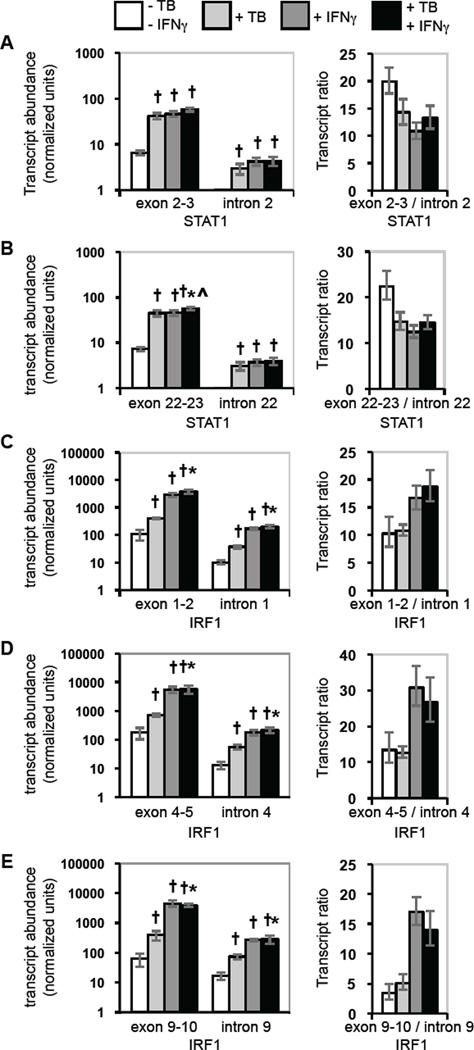
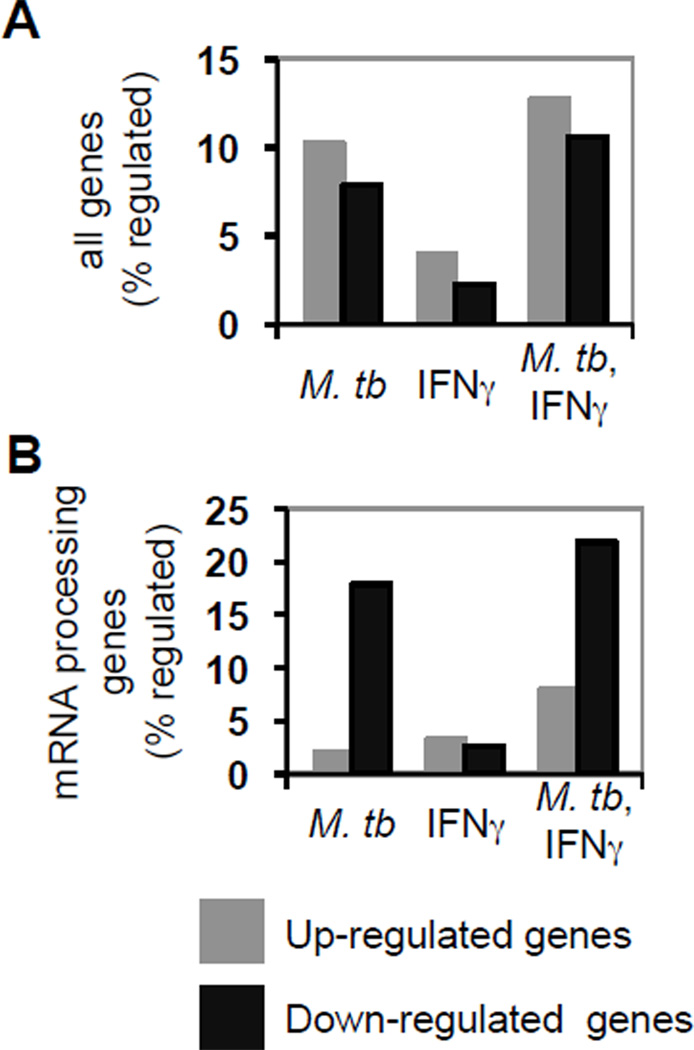
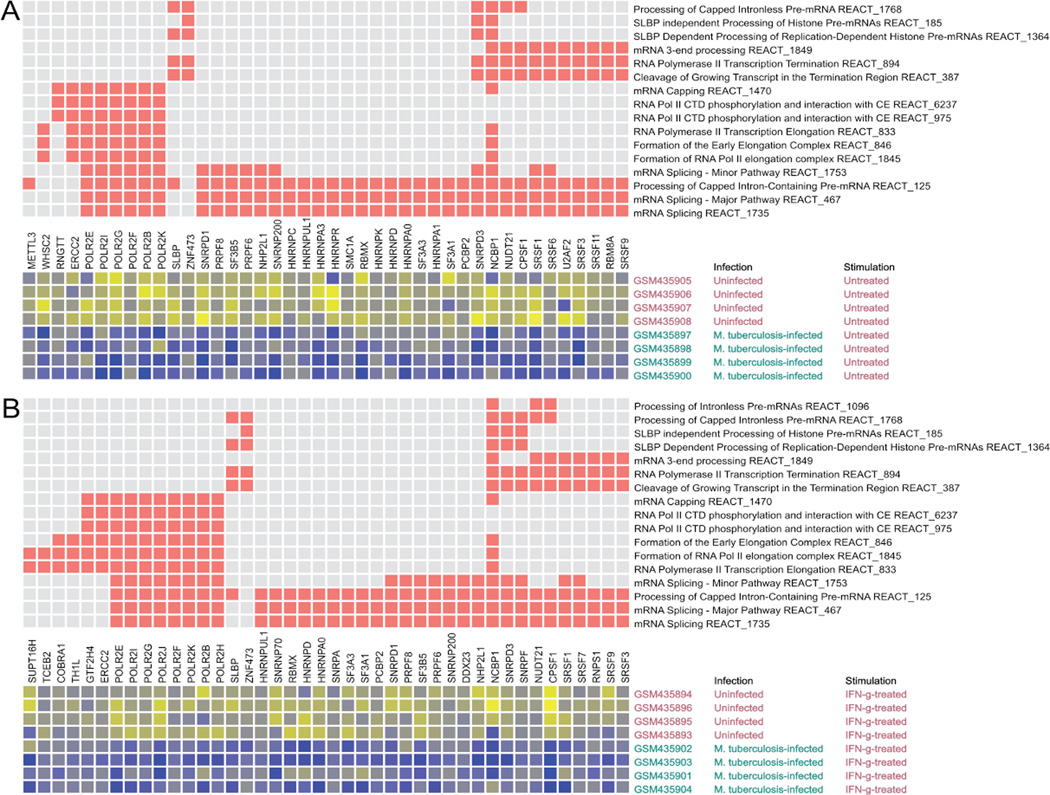
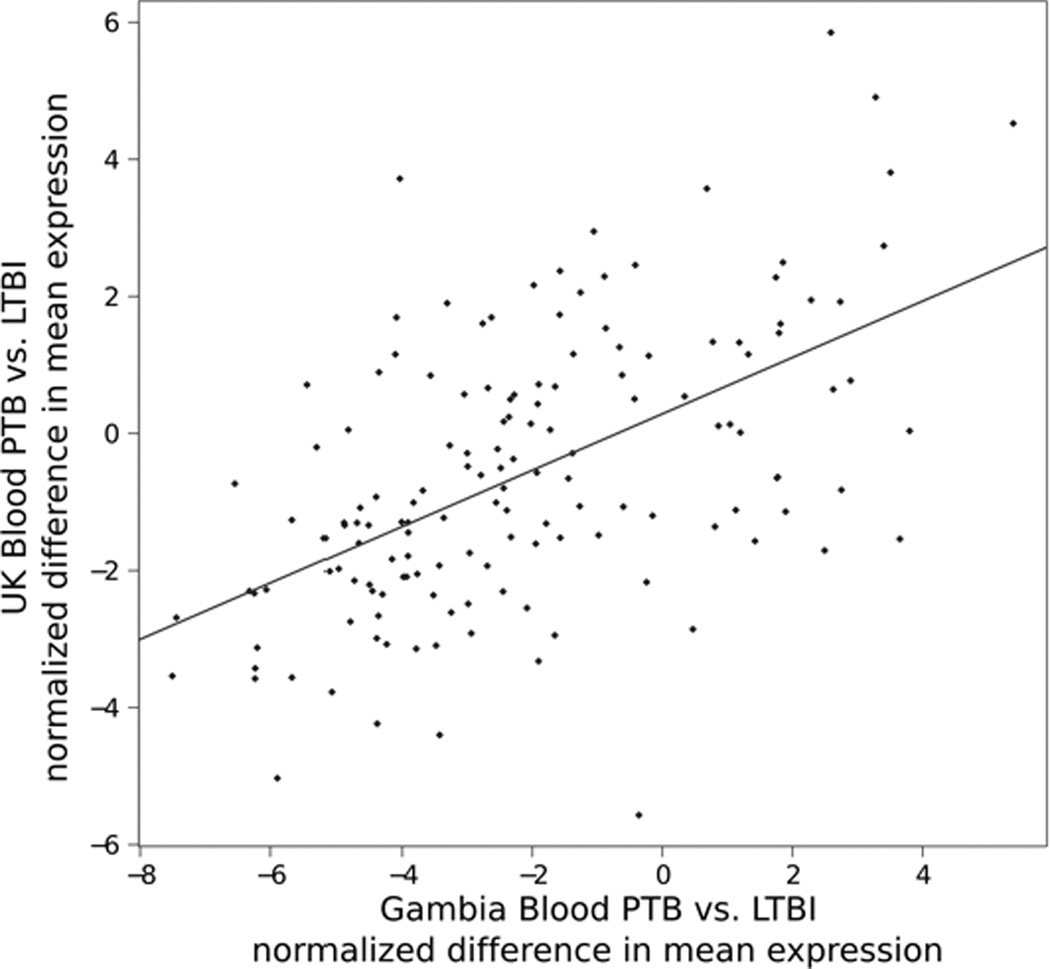
Mycobacterium tuberculosis infection alters macrophage gene expression and macrophage response to IFN-γ, a critical host defense cytokine. However, regulation of these changes is poorly understood. We report discordance of changes in nascent transcript and total nuclear RNA abundance for the transcription factors STAT1 and IRF1, together with lack of effect on their RNA half-lives, in human THP-1 cells infected with M. tuberculosis and stimulated with IFN-γ. The results indicate that negative postinitiation regulation of mRNA biogenesis limits the expression of these factors, which mediate host defense against M. tuberculosis through the cellular response to IFN-γ. Consistent with the results for STAT1 and IRF1, transcriptome analysis reveals downregulation of postinitiation mRNA biogenesis processes and pathways by infection, with and without IFN-γ stimulation. Clinical relevance for regulation of postinitiation mRNA biogenesis is demonstrated by studies of donor samples showing that postinitiation mRNA biogenesis pathways are repressed in latent tuberculosis infection compared with cured disease and in active tuberculosis compared with ongoing treatment or with latent tuberculosis. For active disease and latent infection donors from two populations (London, U.K., and The Gambia), each analyzed using a different platform, pathway-related gene expression differences were highly correlated, demonstrating substantial specificity in the effect. Collectively, the molecular and bioinformatic analyses point toward downregulation of postinitiation mRNA biogenesis pathways as a means by which M. tuberculosis infection limits expression of immunologically essential transcription factors. Thus, negative regulation of postinitiation mRNA biogenesis can constrain the macrophage response to infection and overall host defense against tuberculosis.


Figures

Figure 1
Figure 1
Effects of M. tuberculosis infection and IFNγ stimulation on nascent and total nuclear RNA. THP-1 cells were differentiated, infected with M. tuberculosis and/or stimulated with IFNγ, and then nascent transcripts were measured using the nuclear run-on assay, or total nuclear RNA was extracted and quantified by qRT-PCR. A) The hybridization results for nuclear run-on assays were imaged and quantified using a phosphorimager. The figure is a composite of noncontiguous portions from a single phosphorimager exposure that included the membranes for all four conditions in a representative experiment. B) Nascent transcript measurement is shown as average fold induction ± SEM for 6 replicate experiments. Statistically significant differences (p < 0.05) are indicated compared to control (†), compared to M. tuberculosis (*), and compared to IFNγ (^). C) Total nuclear RNA abundance is shown as average fold induction ± SEM for 4–6 replicate experiments as for panel B. D) The ratios of the abundance of total nuclear RNA relative to the level of nascent transcripts were calculated from the averages for each. Error bars represent ± SEM.
Figure 2
Figure 2
Effects of M. tuberculosis infection and IFNγ stimulation on STAT1 and IRF1 exon and intron half-life in total nuclear RNA. STAT1 and IRF1 transcripts were assayed and the half-life of each target region was calculated. The averages are shown with the range or SEM (see Materials and Methods).
Figure 3
Figure 3
Effects of M. tuberculosis infection and IFNγ stimulation on STAT1 and IRF1 transcript elongation. Intron sequences in total nuclear STAT1 and IRF1 transcripts were assayed. The average fold-induction of each target region is shown. Error bars represent ± SEM for each average and for the ratios. A) STAT1 intron 2 and intron 22. B) IRF1 intron 1 and intron 9. Statistically significant differences are indicated as described in the legend for Fig. 1.
Figure 4
Figure 4
Effects of M. tuberculosis infection and IFNγ stimulation on spliced and unspliced STAT1 and IRF1 transcripts. Exon junction and intron sequences in total nuclear STAT1 and IRF1 transcripts were assayed. The average fold-induction of each target region is shown. Error bars represent ± SEM for each average and for the ratios. A) STAT1 exon 2–3 junction and intron 2. B) STAT1 exon 22–23 junction and intron 22. C) IRF1 exon 1–2 junction and intron 1. D) IRF1 exon 4–5 junction and intron 4. E) IRF1 exon 9–10 junction and intron 10. Statistically significant differences are indicated as described in the legend for Fig. 1.
Figure 5
Figure 5
M. tuberculosis infection and IFNγ stimulation of infected cells preferentially down-regulates genes annotated for mRNA processing. The percentage of A) all genes probed and B) genes having a Gene Ontology annotation for mRNA processing or a descendant that were up or down regulated is shown for THP-1 cells that were infected with M. tuberculosis, stimulated with IFNγ, and infected then stimulated, as indicated. Among down-regulated genes defined by a two-sided Cyber-T p value < 0.05 for cells infected with M. tuberculosis or infected with M. tuberculosis then stimulated with IFNγ, each compared to uninfected cells, genes annotated for mRNA processing or a descendant were over-represented (Fisher's exact test p < 0.0001).
Figure 6
Figure 6
Post-initiation mRNA biogenesis Reactome pathways and genes are down-regulated by M. tuberculosis infection of THP-1 cells. Eighteen pathways were tested. The pathways shown are significantly different for the indicated comparisons (A and B) based on a false discovery rate (FDR) criterion of 0.05 for the CERNO test results. The pathway tests were based on the rank order of differential expression for all genes in a pathway (among all transcript measurements of all named genes targeted by the gene expression platform). The top matrix depicts the membership of genes (columns) in pathways (rows) with red squares. The rows and columns of the top matrix are sorted to bring together similar pathway membership patterns. Genes shown are members of one or more pathways that exhibited differential expression for the indicated comparison (one-sided Student's T-test to assess down-regulation, p < 0.05 unless otherwise noted). The lower matrix is a heatmap of expression for each of the significantly regulated genes in each of the samples that were compared. The heatmap shows gradations from higher to lower expression as yellow to blue. The decrease in expression (blue) is evident for infected cells. Gene symbols are shown with the NCBI Gene IDs. A) 16 pathways were down-regulated when comparing infected THP-1 cells to uninfected cells. B) 17 pathways were down-regulated when comparing THP-1 cells infected with M. tuberculosis and stimulated with IFNγ to uninfected, IFN-γ-stimulated THP-1 cells.
Figure 7
Figure 7
Two comparisons of PTB to LBTI establish specificity in the differential expression of post-initiation mRNA biogenesis genes. Transcript measurements from two independent studies in two geographic regions that implemented different gene expression microarray platforms were compared at the level of differential expression. Differential expression was measured as the difference in mean expression between PTB and LTBI. For the data from each study, the difference in mean expression was normalized to the respective standard error in the estimate of the difference to provide a T-statistic for each probe or probe set. Positive values indicate higher expression in PTB disease relative to LTBI. T-statistics calculated for differential expression of individual genes in each study demonstrated correlation of the direction and magnitude of differential expression of the same genes measured in the two studies. The linear regression trend (red line) is highly significant (p < 1e-12). The significance provides evidence that the pathway level effect arises from particular changes in expression of specific differentially regulated genes.

Similar articles

Cited by

References

    1. Corbett EL, Watt CJ, Walker N, Maher D, Williams BG, Raviglione MC, Dye C. The growing burden of tuberculosis: global trends and interactions with the HIV epidemic. Arch. Intern. Med. 2003;163:1009–1021. - PubMed
    1. Enarson DA, Chiang C-Y, Murray, F J. Global Epoidemiology of Tuberculosis. In: Rom WN, Garay SM, editors. Tuberculosis. second ed. New York: Lippincott Williams & Wilkins; 2004. pp. 13–29.
    1. Kim HR, Hwang SS, Kim HJ, Lee SM, Yoo CG, Kim YW, Han SK, Shim YS, Yim JJ. Impact of extensive drug resistance on treatment outcomes in non-HIV-infected patients with multidrug-resistant tuberculosis. Clin. Infect. Dis. 2007;45:1290–1295. - PubMed
    1. Sotgiu G, Ferrara G, Matteelli A, Richardson MD, Centis R, Ruesch-Gerdes S, Toungoussova O, Zellweger JP, Spanevello A, Cirillo D, Lange C, Migliori GB. Epidemiology and clinical management of XDR-TB: a systematic review by TBNET. Eur. Respir. J. 2009;33:871–881. - PubMed
    1. Ernst JD. The immunological life cycle of tuberculosis. Nat Rev Immunol. 2012;12:581–591. - PubMed

Publication types

MeSH terms

Associated data