. 2013 Mar 15;190(6):2659-69.
doi: 10.4049/jimmunol.1202531. Epub 2013 Feb 1.

The Tec kinase ITK regulates thymic expansion, emigration, and maturation of γδ NKT cells

Affiliations

The Tec kinase ITK regulates thymic expansion, emigration, and maturation of γδ NKT cells

Catherine C Yin et al. J Immunol. .

Abstract

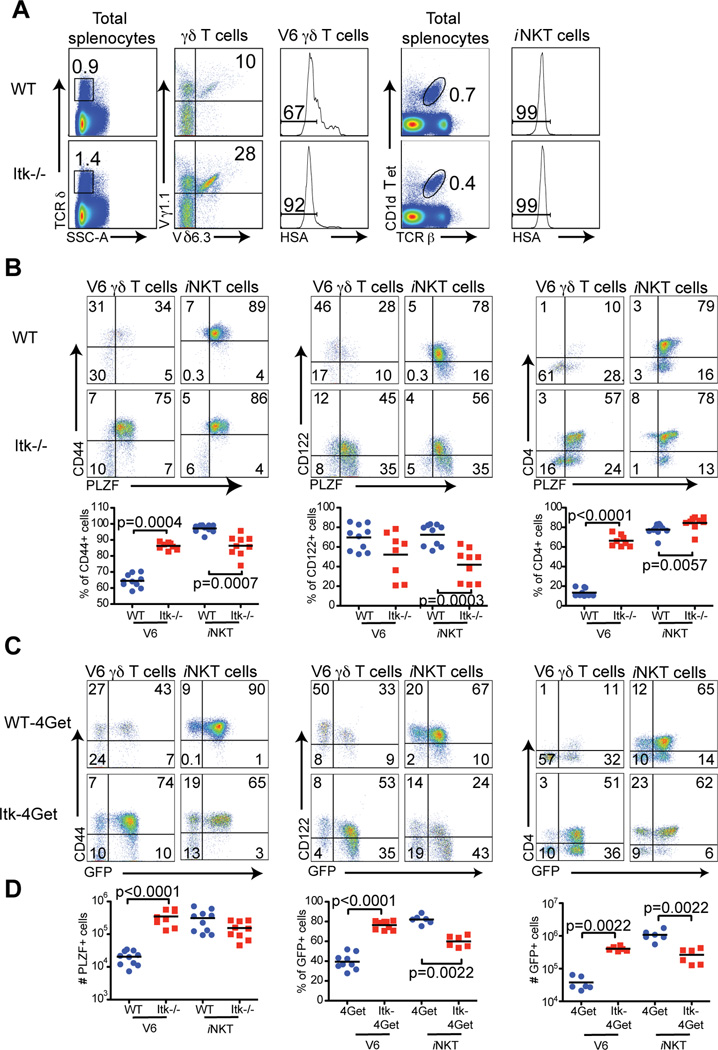
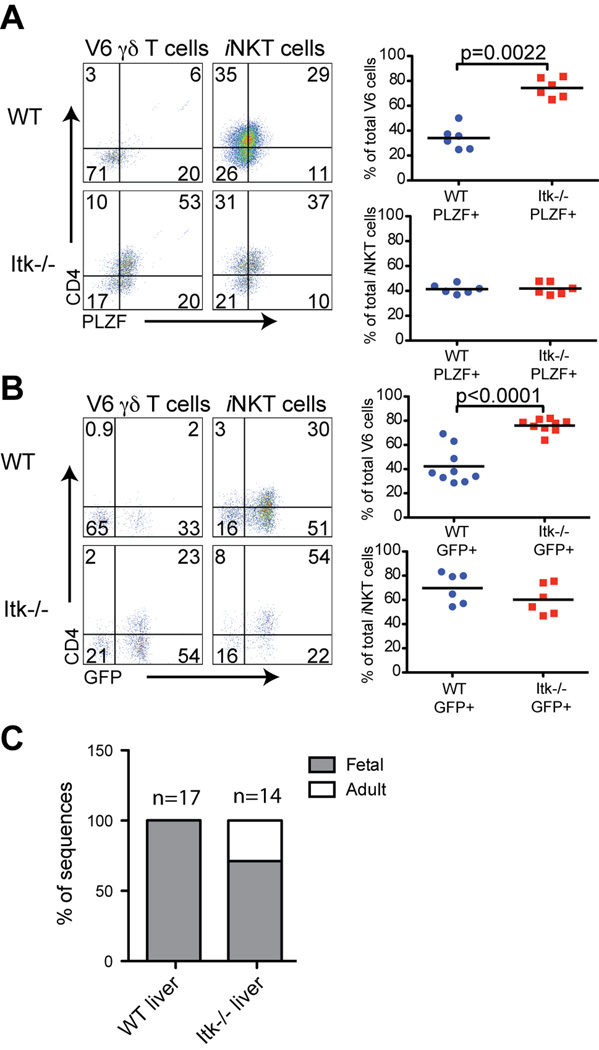
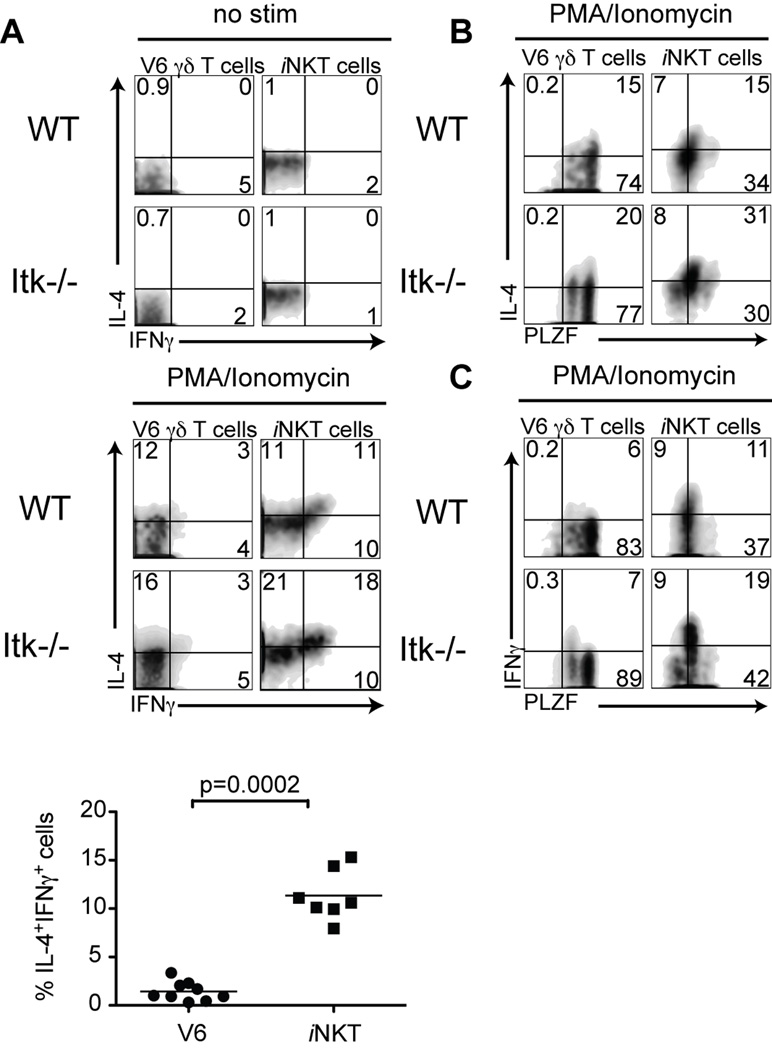
The Tec family tyrosine kinase, Itk, regulates signaling downstream of the TCR. The absence of Itk in CD4(+) T cells results in impaired Th2 responses along with defects in maturation, cytokine production, and survival of iNKT cells. Paradoxically, Itk(-/-) mice have spontaneously elevated serum IgE levels, resulting from an expansion of the Vγ1.1(+)Vδ6.3(+) subset of γδ T cells, known as γδ NKT cells. Comparisons between γδ NKT cells and αβ iNKT cells showed convergence in the pattern of cell surface marker expression, cytokine profiles, and gene expression, suggesting that these two subsets of NKT cells undergo similar differentiation programs. Hepatic γδ NKT cells have an invariant TCR and are derived predominantly from fetal progenitors that expand in the thymus during the first weeks of life. The adult thymus contains these invariant γδ NKT cells plus a heterogeneous population of Vγ1.1(+)Vδ6.3(+) T cells with diverse CDR3 sequences. This latter population, normally excluded from the liver, escapes the thymus and homes to the liver when Itk is absent. In addition, Itk(-/-) γδ NKT cells persistently express high levels of Zbtb16 (PLZF) and Il4, genes that are normally downregulated in the most mature subsets of NKT cells. These data indicate that Itk signaling is required to prevent the expansion of γδ NKT cells in the adult thymus, to block their emigration, and to promote terminal NKT cell maturation.


Figures

Figure 1
Figure 1. Splenic γδ NKT cells in Itk−/− mice have increased expression of PLZF and IL-4 mRNA
Splenocytes from WT and Itk−/− mice, or WT-4Get and Itk−/−-4Get mice were stained and analyzed by flow cytometry. (A) Total splenocytes were analyzed for TCRδ (left panels), and positive cells were gated on and examined for Vγ1.1 and Vδ6.3 expression (second panels). V6 cells were further examined for HSA expression (third panels). iNKT cells were identified by staining with CD1d tetramer and anti-TCR (fourth panels). iNKT cells further examined for HSA expression (right panels). (B) HSA V6 γδ T cells and iNKT cells in the spleen were analyzed for expression of CD44, CD122, CD4 and intracellular PLZF. The mean fluorescent intensity of total PLZF in V6 cells is 395±41 for WT and 733±24 for Itk−/−. Dot-plots show representative data; compilations of data from of all experiments are shown in the graphs below. Each data point represents one mouse and the black bars indicate the means. Statistically significant differences are shown with p values. (C) HSA V6 γδ T cells and iNKT cells from WT-4Get and Itk−/−-4Get mice were stained and analyzed for CD44 vs GFP, CD122 vs GFP and CD4 vs GFP expression. Data are representative of at least two independent experiments. (D) Compilations of data show absolute numbers of PLZF+ cells, and percentages and absolute numbers of GFP+ cells within the HSA V6 γδ T cell or iNKT cell population. Statistically significant differences are shown with p values.
Figure 2
Figure 2. γδ NKT cells in the livers of Itk−/− have increased PLZF and IL-4 mRNA expression
Lymphocytes were isolated from livers of WT and Itk−/− mice or WT-4Get and Itk−/−-4Get mice and were analyzed by flow cytometry. (A) WT and Itk−/− HSA V6 γδ T cells and iNKT cells were examined for CD4 versus PLZF expression. Dot-plots show representative data, and the graphs show a compilation of data from all experiments. Statistically significant differences are shown with p values. (B) WT-4Get and Itk−/−-4Get HSA V6 γδ T cells and iNKT cells were analyzed for expression of CD4 and GFP. Dot-plots show representative data, and the graphs show compilations of data from all experiments. Statistically significant differences are shown with p values. (C) Sorted V6 γδ T cells from WT and Itk−/− livers were analyzed for in-frame sequences of Vδ6 and Jδ1 junctions. The graph indicates the percentage of sequences corresponding to fetal-derived rearrangements or adult-derived rearrangements. The total number of sequences included in the analysis is indicated above each bar. Actual sequences are shown in Figure S1.
Figure 3
Figure 3. γδ NKT cells in the thymus of Itk−/− mice have characteristics of less mature αβ iNKT cells
Thymocytes from WT and Itk−/− mice, or WT-4Get and Itk−/−-4Get mice were stained and analyzed by flow cytometry. (A) Total thymocytes were analyzed for TCR versus TCRδ (left panels), and TCRδ-positive cells were gated on and examined for Vγ1.1 and Vδ6.3 expression (second panels). V6 cells were further gated on HSA (third panels). iNKT cells were identified by staining with CD1d tetramer and anti-TCR² (fourth panels). iNKT cells were further gated on HSA expression (right panels). (B) HSA V6 γδ T cells and iNKT cells in the thymus were analyzed for expression of CD44, CD122, CD4 and intracellular PLZF. Dot-plots show representative data; compilations of data from of all experiments are shown in the graphs below. Statistically significant differences are shown with p values. (C) HSA V6 γδ T cells and iNKT cells from WT-4Get and Itk−/−-4Get mice were stained and analyzed for CD44 vs GFP, CD122 vs GFP and CD4 vs GFP expression. Data are representative of at least two independent experiments. (D) PLZFhi and PLZFint V6 γδ T cell and iNKT cell populations were gated as shown in panel B and absolute numbers were calculated (left two panels). The percentages and absolute numbers of GFP+ cells in the HSA V6 γδ T cell and iNKT cell populations are shown (right two panels). Statistically significant differences are shown with p values.
Figure 4
Figure 4. Levels of PLZF expression correlate with IFNγ production by γδ NKT cells
Thymocytes from WT or Itk−/− mice were stimulated with10ng/ml PMA and 2 µg/ml Ionomycin for 5 hours, and then stained for intracellular IL-4, IFNγ and PLZF. Dot-plots show gated HSA V6 thymocytes or CD1d tetramer positive cells. (A) Non-stimulated (top) and stimulated (middle) cells were analyzed for IFNγ versus IL-4 production. The graph (bottom) shows a compilation of data indicating the percentage of double IL-4+ IFNγ+-producing cells among WT V6 compared to iNKT cells. Statistical significance is shown with p value. (B, C) Stimulated cells were analyzed for IL-4 versus PLZF expression (B) or IFNγ versus PLZF expression (C).
Figure 5
Figure 5. Gene expression microarray analysis indicates impaired terminal maturation of Itk−/− γδ NKT cells
(A) Scatter plot showing expression of consolidated probe sets by CD24(HSA)lo V6 γδ T cells in thymocytes from adult WT and Itk−/− mice. Nomenclature is according to ImmGen (immgen.org): MatV6.WT= CD24(HSA)lo V6 γδ T cells from adult WT thymus; TotalV6.Itk−/−, total V6 γδ T cells from adult Itk−/− thymus, which are 95–98% CD24lo. Each dot represents one gene (mean of all probe sets and mean of replicates); red and blue indicate genes with expression increased or decreased, respectively, by more than twofold (P < 0.05 (Student's t-test); coefficient of variation < 0.5; mean expression value (MEV) > 120 in one subset); numbers in parentheses above plot indicates total number of these genes. The numbers within the plot indicate the number of up-regulated (red) or down-regulated (blue) genes in the comparison. Data are from three independent experiments with 4–30 mice each. (B) The 124 genes increased in MatV6.WT versus TotalV6.Itk−/− cells were classified into functional pathways using the KEGG analysis program (DAVID). The top five pathways enriched in the dataset are shown along with the number of genes, the gene names, the P-value, and the Benjamini P-value for each pathway. (C) Venn diagram comparing the list of genes that were increased or decreased in iNKT (NKT.44+NK1.1+) cells versus MatCD4 (CD24lo) and MatCD8 (CD24lo) single positive thymocytes (identified previously in (21)) with the list of 124 genes down-regulated in TotalV6.Itk−/− versus MatV6.WT cells. Roughly 40% of the genes decreased in TotalV6.Itk−/− versus MatV6.WT cells are normally increased in NKT.44+NK1.1+ cells versus mature single-positives. (D) Heat map showing relative expression of the 51 genes identified in Figure 5C that were decreased in TotalV6.Itk−/− versus MatV6.WT cells and increased in NKT.44+NK1.1+ cells versus MatCD4 and MatCD8 single positive thymoctyes in populations of NKT and MatCD4 cells from WT mice and V6 cells from WT or Itk−/− mice. Data were log transformed, centered by gene row and hierarchically clustered by gene and subset. The clustering dendrogram for samples is shown. Color coding reflects relative expression levels of a given gene in each subset, and does not provide information about absolute expression levels of each gene.
Figure 6
Figure 6. Decreased surface expression of NK cell markers on Itk−/− V6 cells
(A) Thymocytes from WT and Itk−/− mice were stained for expression of NK1.1 along with CD122, CD44 and CD4. (B) Thymocytes from WT and Itk−/− mice were stained for expression of NK cell markers CD49a (ITGA1), 2B4 (CD244), Ly49E/F (KLRA5/6), NKG2A/C/E (KLRC1/2/3), CD94 (KLRD1) and CD122. Dot-plots show gated CD24lo V6+ cells. Results are representative of 2 experiments with at least 3 mice per group.
Figure 7
Figure 7. The expanded population of γδ NKT cells in the thymus of Itk−/− mice include cells derived from both fetal and adult progenitors
The graph shows the relative proportions of in-frame TCR Vδ6 and Jδ1 junctions in three subsets of sorted thymocytes from WT-4Get and Itk−/−-4Get mice that derive from fetal versus adult progenitors. Populations analyzed were: CD122GFP+ (Stage 1), CD122+GFP+ (Stage 2), and CD122+GFP (Stage 3). The total number of sequences included in the analysis is indicated above each bar. Statistically significant differences were determined using the exact binomial test of goodness-of-fit, and p values are shown. At the right, the gating strategy for isolation of each thymocyte subset is shown.
Figure 8
Figure 8. A model of V6 development in wild type and Itk−/− mice
In wild-type (WT) mice (left), V6 cells initially develop from fetal precursors (pink) and expand in the thymus during the first two weeks after birth (22). These cells undergo a maturation program similar to αβ iNKT cells before emigrating to the periphery, with a preference for homing to the liver (bold pink). As WT mice age, a second wave of V6 cells develops from adult precursors (blue) and matures prior to emigrating to peripheral lymphoid organs. A small number of fetal-derived and adult-derived V6 cells are present and continuously maturing in the thymus of adult mice. Similar to WT V6 cells, Itk−/− V6 cells (right) also initially develop from fetal precursors (pink) and preferentially home to the liver; however increased numbers of V6 cells are found in the absence of Itk. A second wave of adult precursor-derived Itk−/− V6 cells also develops in increased numbers (blue). Itk−/− V6 cells have a defect in terminal maturation and retain high expression of PLZF and IL-4 relative to WT V6 cells. In addition, Itk−/− V6 cells arising from adult precursors are able to emigrate to the liver (green). E20, embryonic day 20.

Similar articles

Cited by

References

    1. Andreotti AH, Schwartzberg PL, Joseph RE, Berg LJ. T-Cell Signaling Regulated by the Tec Family Kinase, Itk. Cold Spring Harbor Perspectives in Biology. 2010;2:a002287–a002287. - PMC - PubMed
    1. Kaech SM, Wherry EJ, Ahmed R. Effector and memory T-cell differentiation: implications for vaccine development. Nat. Rev. Immunol. 2002;2:251–262. - PubMed
    1. Surh CD, Sprent J. Regulation of mature T cell homeostasis. Seminars in Immunology. 2005;17:183–191. - PubMed
    1. Jameson SC. T cell homeostasis: keeping useful T cells alive and live T cells useful. Seminars in Immunology. 2005;17:231–237. - PubMed
    1. Smith-Garvin JE, Koretzky GA, Jordan MS. T Cell Activation. Annu. Rev. Immunol. 2009;27:591–619. - PMC - PubMed

Publication types

MeSH terms

Substances