. 2013 Mar 22;288(12):8667-8678.
doi: 10.1074/jbc.M112.410829. Epub 2013 Feb 1.

Ligand binding to anion-binding exosites regulates conformational properties of thrombin

Affiliations

Ligand binding to anion-binding exosites regulates conformational properties of thrombin

Marina V Malovichko et al. J Biol Chem. .

Abstract

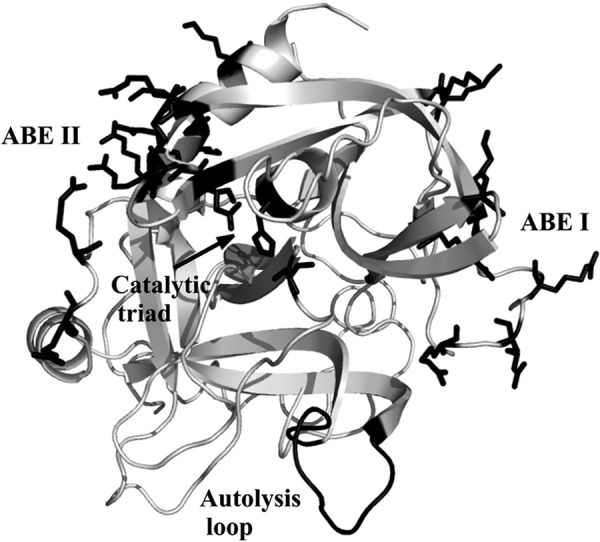
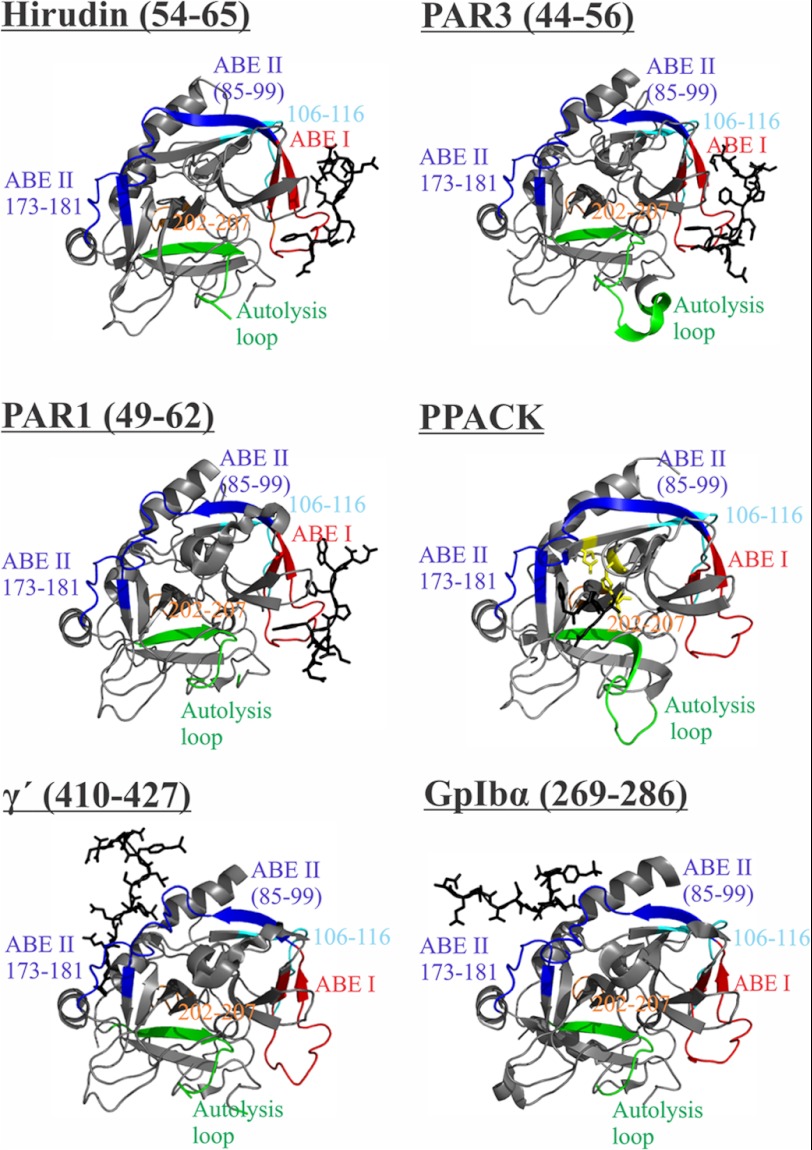
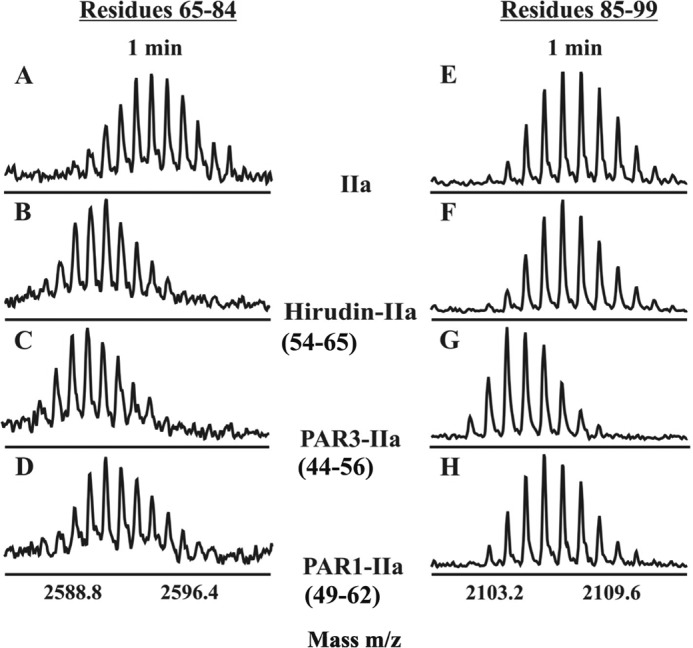
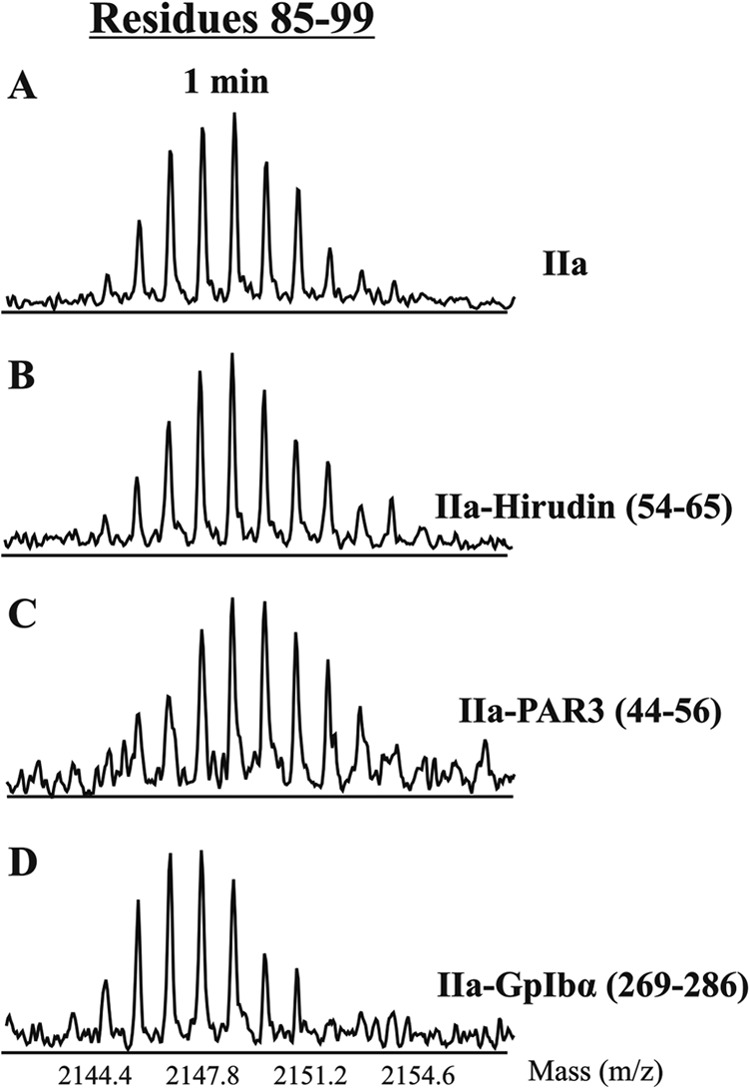
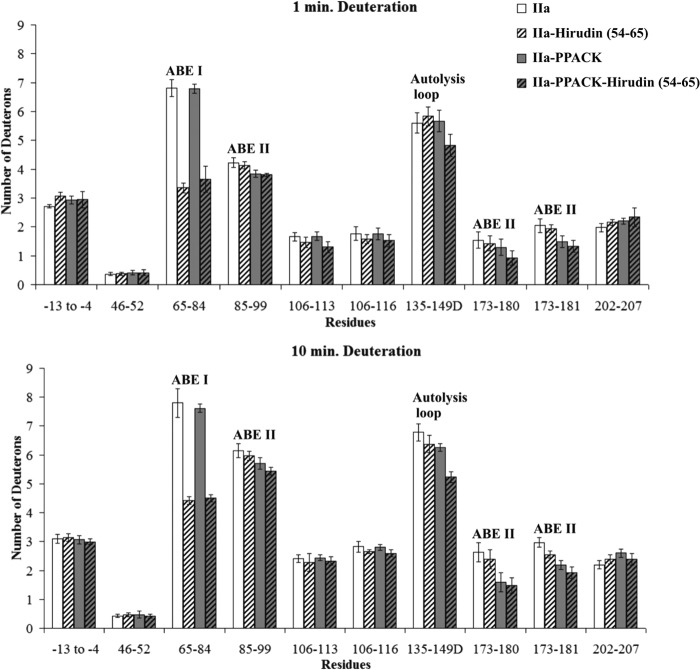
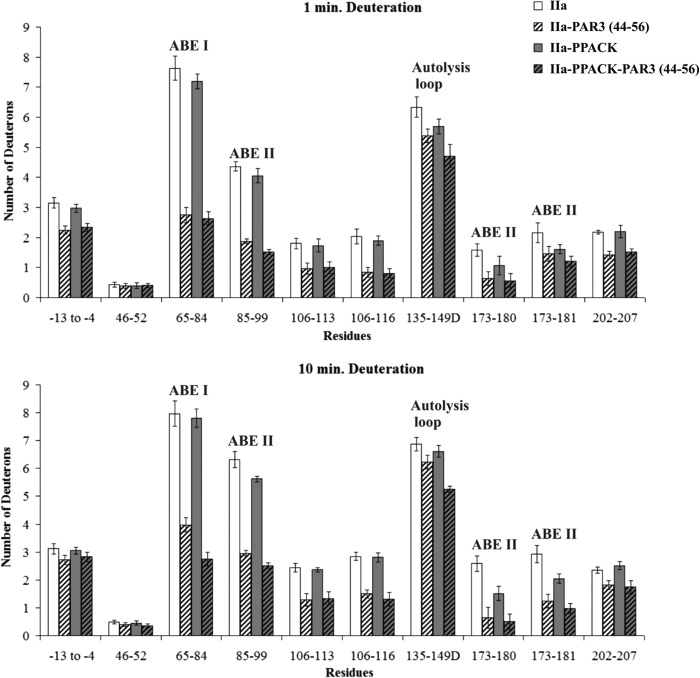
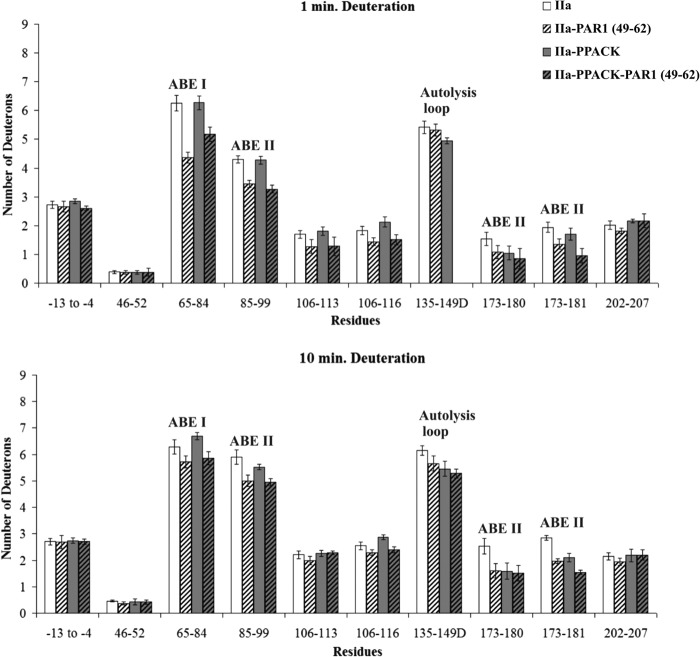
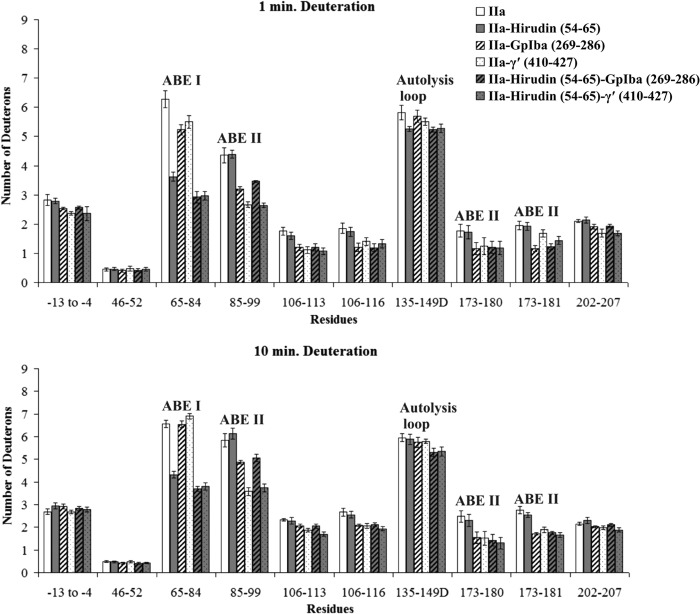
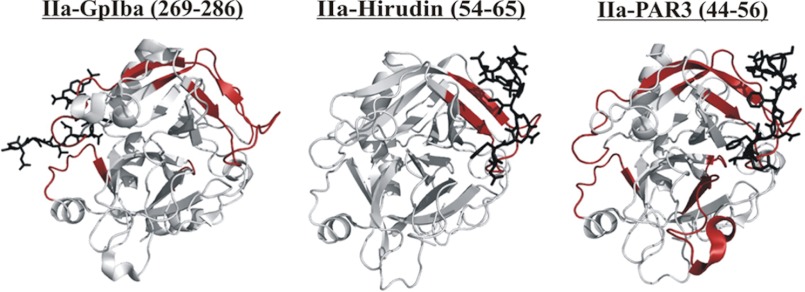
Thrombin participates in coagulation, anticoagulation, and initiation of platelet activation. To fulfill its diverse roles and maintain hemostasis, this serine protease is regulated via the extended active site region and anion-binding exosites (ABEs) I and II. For the current project, amide proton hydrogen-deuterium exchange coupled with MALDI-TOF mass spectrometry was used to characterize ligand binding to individual exosites and to investigate the presence of exosite-active site and exosite-exosite interactions. PAR3(44-56) and PAR1(49-62) were observed to bind to thrombin ABE I and then to exhibit long range effects over to ABE II. By contrast, Hirudin(54-65) focused more on ABE I and did not transmit influences over to ABE II. Although these three ligands were each directed to ABE I, they did not promote the same conformational consequences. D-Phe-Pro-Arg-chloromethyl ketone inhibition at the thrombin active site led to further local and long range consequences to thrombin-ABE I ligand complexes with the autolysis loop often most affected. When Hirudin(54-65) was bound to ABE I, it was still possible to bind GpIbα(269-286) or fibrinogen γ'(410-427) to ABE II. Each ligand exerted its predominant influences on thrombin and also allowed interexosite communication. The results obtained support the proposal that thrombin is a highly dynamic protein. The transmission of ligand-specific local and long range conformational events is proposed to help regulate this multifunctional enzyme.


Figures

FIGURE 1.
FIGURE 1.
Highlighting key sites on the serine protease thrombin. The catalytic triad, the anion-binding exosites, and the autolysis loop are marked in black. The catalytic triad is represented by Ser195, His57, and Asp102 and shown as sticks. The anion-binding exosites of thrombin (ABE I and ABE II) are located at opposite sides of the active site and are shown as sticks. The Protein Data Bank code was 1PPB. The figure was prepared with PyMOL.
FIGURE 2.
FIGURE 2.
Thrombin-ligand complexes. Ligands bound to thrombin such as Hirudin(54–65), PAR3(44–56), PAR1(49–62), PPACK, fibrinogen γ′(410–427), and GpIbα(269–286) are depicted as black sticks. Thrombin fragments obtained by peptic digest that represent ABE I, ABE II, autolysis loop, 106–116 and 202–207 regions are colored in red, dark blue, green, cyan, and orange, respectively. The catalytic triad is shown as sticks in yellow (for the IIa-PPACK complex). Protein Data Bank codes include 1HAH for Hirudin(54–65), 2PUX for PAR3(44–56), 1PPB for PPACK, 2HWL for fibrinogen γ′(410–427), and 1P8V for GpIbα(269–286). The figure was prepared with PyMOL.
FIGURE 3.
FIGURE 3.
HDX centroids shifts because of exosite ligand binding. Centroids for the ABE I segment 65–84 (A–D) and the ABE II segment 85–99 (E–H) following 1 min of deuteration in the following environments: free thrombin (A and E), Hirudin(54–65)-thrombin (B and F), PAR3(44–56)-thrombin (C and G), and PAR1(49–62)-thrombin (D and H).
FIGURE 4.
FIGURE 4.
HDX centroid shifts examining ability of γ-thrombin to accommodate exosite ligands. Shown are centroids for the ABE II segment 85–99 following 1 min of deuteration in the following environments: free γ-thrombin (A), γ-thrombin-Hirudin(54–65) (B), γ-thrombin-PAR3(44–56) (C), and γ-thrombin-GpIbα(269–286) (D).
FIGURE 5.
FIGURE 5.
Deuterium incorporation for the Hirudin(54–65)-thrombin complex in the presence and absence of PPACK. The bars in the graphs correspond to deuterium incorporation of free thrombin (white), Hirudin(54–65)-bound thrombin (white striped), PPACK-inhibited thrombin (gray), and PPACK-inhibited thrombin in the presence of Hirudin(54–65) (gray striped). Values for both 1 and 10 min of deuteration are displayed. The error bars correspond to standard deviations for three independent trials.
FIGURE 6.
FIGURE 6.
Deuterium incorporation for the PAR3(44–56)-thrombin complex in the presence and absence of PPACK. The bars in the graphs correspond to deuterium incorporation of free thrombin (white), PAR3(44–56)-bound (striped white), PPACK-inhibited thrombin (gray), and the ternary IIa-PPACK-PAR3(44–56) complex (gray striped). Values for both 1 and 10 min of deuteration are displayed. The error bars correspond to standard deviations for three independent trials.
FIGURE 7.
FIGURE 7.
Deuterium incorporation for the PAR1(49–62)-thrombin complex in the presence and absence of PPACK. The bars in the graphs correspond to deuterium incorporation of free thrombin (white), PAR1(49–62)-bound thrombin (white striped), PPACK-inhibited thrombin (gray), and the ternary IIa-PPACK-PAR1(49–62) complex (gray striped). Values for both 1 and 10 min of deuteration are displayed. The error bars correspond to standard deviations for three independent trials.
FIGURE 8.
FIGURE 8.
Deuterium incorporation when both exosites are occupied. The bars in the graphs correspond to deuterium incorporation of free thrombin (white), binary thrombin-Hirudin(54–65) complex (gray), binary thrombin-GpIbα(269–286) complex (striped white), binary thrombin-γ′(410–427) complex (dotted white), ternary thrombin-Hirudin(54–65)-GpIbα(269–286) complex (striped gray), and ternary thrombin-Hirudin(54–65)-γ′(410–427) complex (dotted gray). Values for both 1 and 10 min of deuteration are displayed. The error bars correspond to standard deviations for three independent trials.
FIGURE 9.
FIGURE 9.
The HDX binding patterns of various thrombin ligands. Thrombin segments that were protected from solvent exchange following 10 min of deuteration are colored in red. The observed HDX effects were statistically different from the values obtained with free thrombin at a level of p ≤ 0.001. The individual ligands bound to thrombin including GpIbα(269–286) (Protein Data Bank code 1P8V), Hirudin(54–65) (Protein Data Bank code 1HAH), and PAR3(44–56) (Protein Data Bank code 2PUX) are depicted as black sticks. The figure was prepared with PyMOL.

References

    1. Di Cera E. (2008) Thrombin. Mol. Aspects Med. 29, 203–254 - PMC - PubMed
    1. Lane D. A., Philippou H., Huntington J. A. (2005) Directing thrombin. Blood 106, 2605–2612 - PubMed
    1. Bock P. E., Panizzi P., Verhamme I. M. (2007) Exosites in the substrate specificity of blood coagulation reactions. J. Thromb. Haemost. 5, 81–94 - PMC - PubMed
    1. Dang Q. D., Sabetta M., Di Cera E. (1997) Selective loss of fibrinogen clotting in a loop-less thrombin. J. Biol. Chem. 272, 19649–19651 - PubMed
    1. Bode W., Turk D., Karshikov A. (1992) The refined 1.9-A x-ray crystal structure of d-Phe-Pro-Arg chloromethylketone-inhibited human α-thrombin. Structure analysis, overall structure, electrostatic properties, detailed active-site geometry, and structure-function relationships. Protein Sci. 1, 426–471 - PMC - PubMed

Publication types