. 2013:3:1197.
doi: 10.1038/srep01197. Epub 2013 Feb 1.

Human adipose tissue-derived mesenchymal stem cells secrete functional neprilysin-bound exosomes

Affiliations

Human adipose tissue-derived mesenchymal stem cells secrete functional neprilysin-bound exosomes

Takeshi Katsuda et al. Sci Rep. 2013.

Abstract

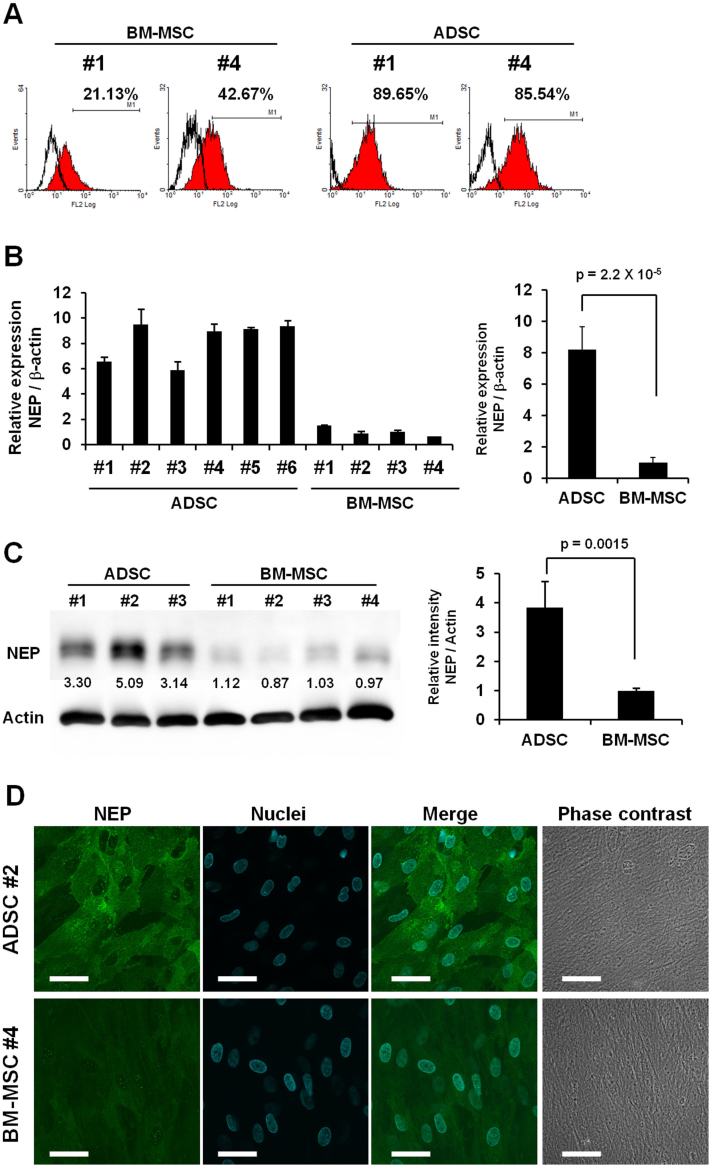
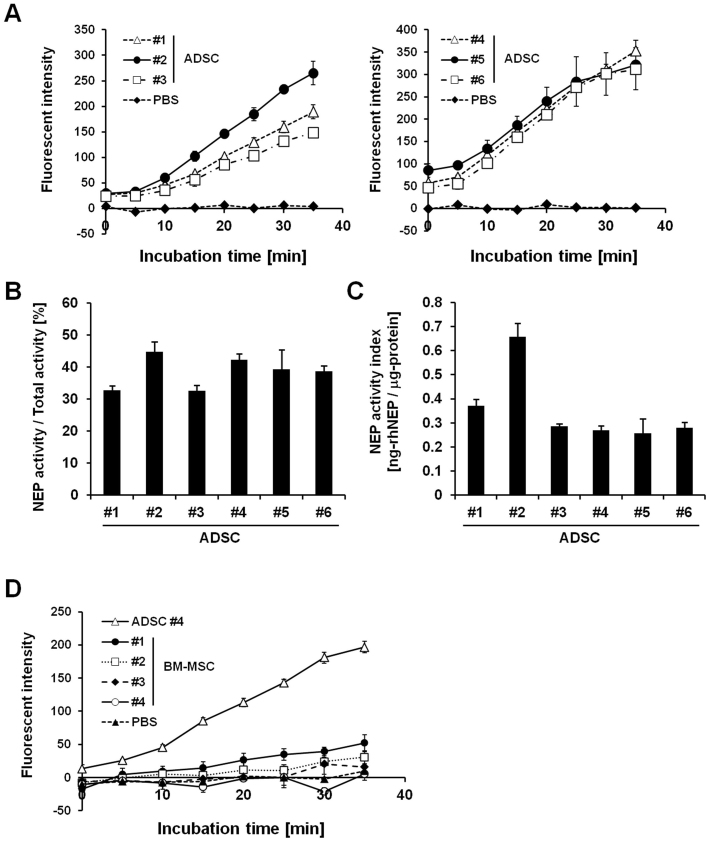
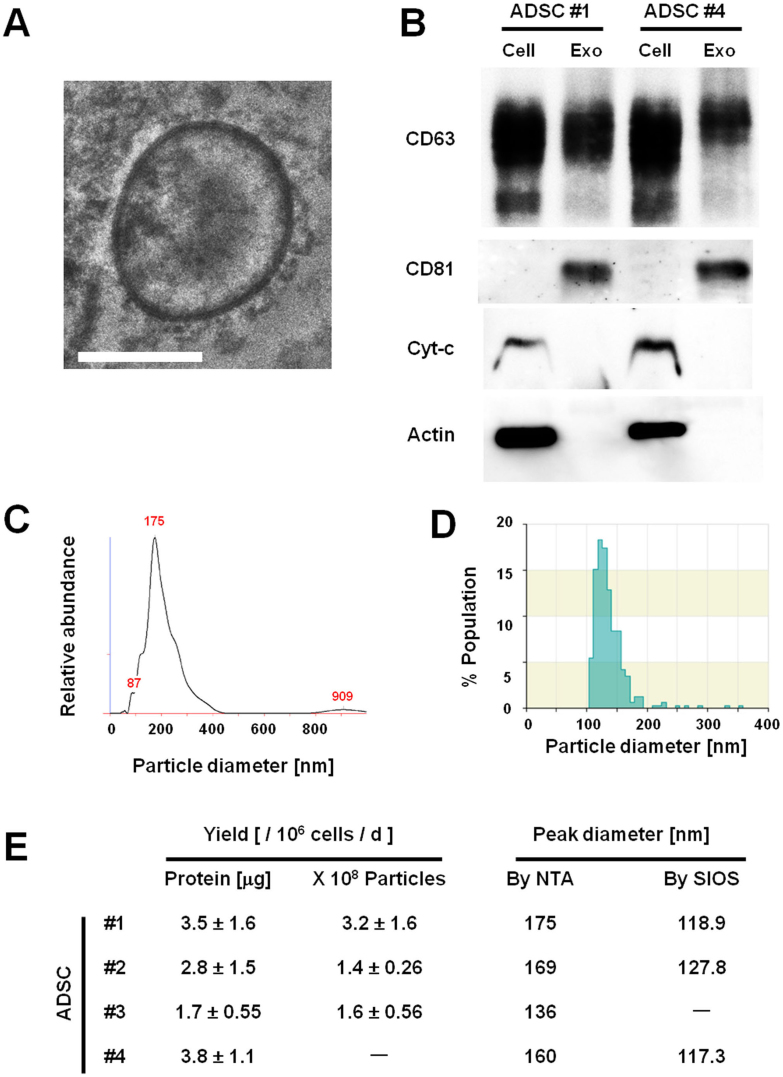
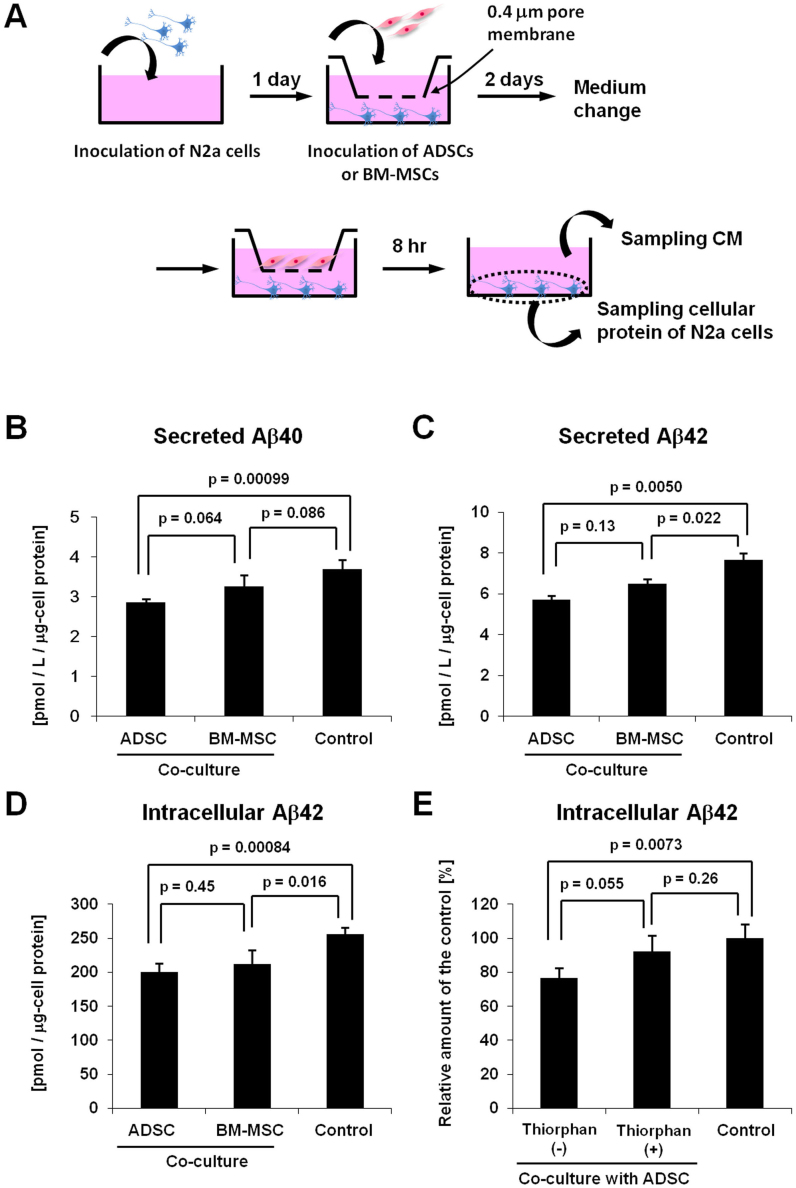
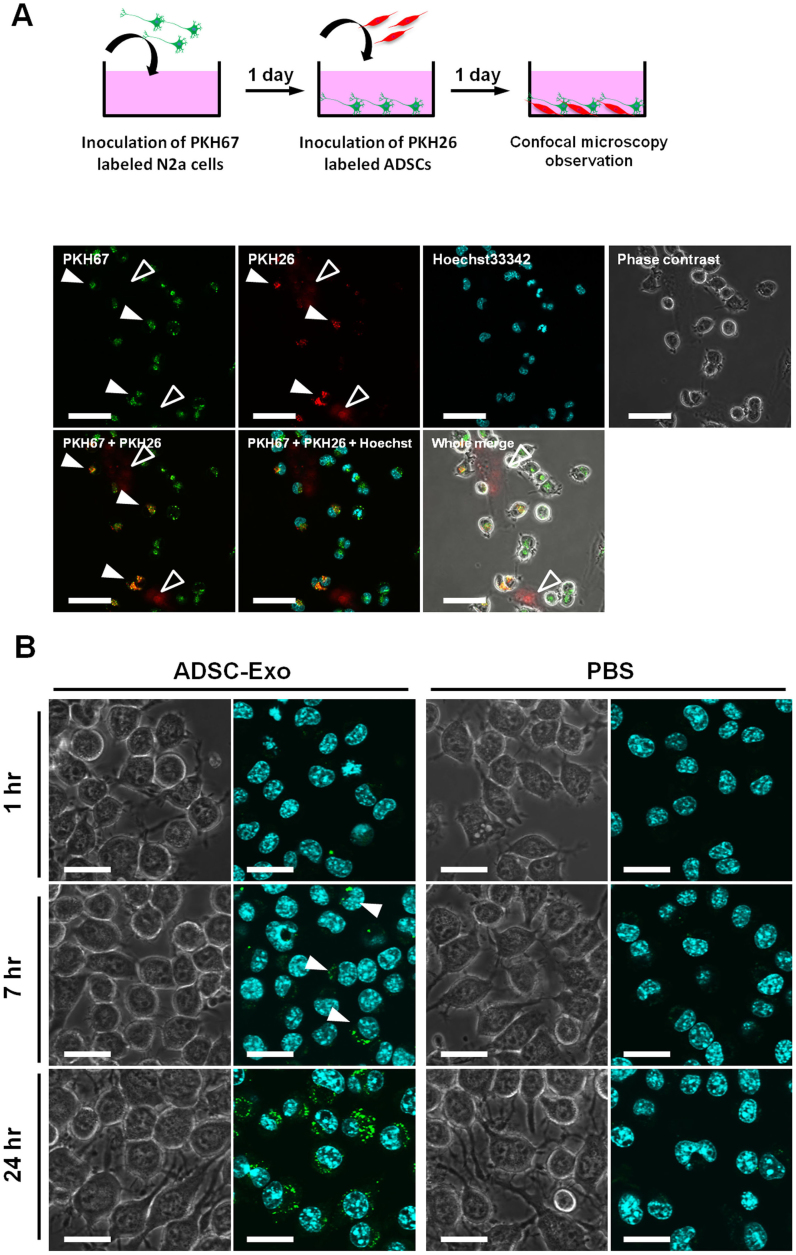
Alzheimer's disease (AD) is characterized by the accumulation of β-amyloid peptide (Aβ) in the brain because of an imbalance between Aβ production and clearance. Neprilysin (NEP) is the most important Aβ-degrading enzyme in the brain. Thus, researchers have explored virus-mediated NEP gene delivery. However, such strategies may entail unexpected risks, and thus exploration of a new possibility for NEP delivery is also required. Here, we show that human adipose tissue-derived mesenchymal stem cells (ADSCs) secrete exosomes carrying enzymatically active NEP. The NEP-specific activity level of 1 μg protein from ADSC-derived exosomes was equivalent to that of ~ 0.3 ng of recombinant human NEP. Of note, ADSC-derived exosomes were transferred into N2a cells, and were suggested to decrease both secreted and intracellular Aβ levels in the N2a cells. Importantly, these characteristics were more pronounced in ADSCs than bone marrow-derived mesenchymal stem cells, suggesting the therapeutic relevance of ADSC-derived exosomes for AD.


Figures

Figure 1
Figure 1. ADSCs express NEP at a higher level than BM-MSCs.
(A) Flow cytometry results of ADSCs #1 and #4 and BM-MSCs #1 and #4 for NEP. (B) qRT-PCR analysis of NEP in ADSCs and BM-MSCs. Transcript levels were normalized to β-actin levels. Data are the mean ± S.D. (n = 3). (C) Cell lysates of ADSCs or BM-MSCs were analyzed by immunoblotting with an anti-NEP or an anti-actin antibody (left). Either 3 μg or 1 μg of cell lysate protein per lane was loaded for NEP and actin, respectively. The relative signal intensity (NEP/Actin) for each sample was measured, and normalized values are shown in the graph. The average values of ADSCs and BM-MSCs are compared on the right. Data are the mean ± S.D. (D) Immuno cytochemistry of ADSCs for NEP. ADSCs were stained with a mouse-anti NEP monoclonal antibody (green), and nuclei were counterstained with Hoechst 33342 (blue). Scale bar: 50 μm.
Figure 2
Figure 2. ADSCs, but not BM-MSCs, exhibit NEP-specific enzyme activity.
(A) NEP-specific enzyme activity was measured in ADSC cell lysates (left: #1–3 and right: #4–6) using a fluorogenic peptide substrate, Mca-RPPGFSAFK(Dnp). The average NEP activity represented by fluorescence intensity was measured with a reading interval of 5 min. The specific NEP activity was calculated by subtracting residual fluorescent intensity after incubation with the NEP inhibitor thiorphan (Fig. S2 A–D). Data are the mean ± S.D. (n = 3). (B) NEP contribution ratio calculated as the percentage ratio of NEP-specific activity rate to total activity rate. NEP-specific or total enzyme activity rate was determined as the gradient of the corresponding time course of fluorescent intensity. Data are the mean ± S.D. (n = 3). (C) NEP-specific enzyme activity levels of ADSCs were estimated from rhNEP standard curves (Fig. S2 E–H) and represented as the value ng-rhNEP/μg-protein (termed as NEP activity index in the diagram). Data are the mean ± S.D. (n = 3). (D) Comparison of NEP-specific enzyme activity levels between ADSC #4 and BM-MSCs #1–4. Data are the mean ± S.D. (n = 3).
Figure 3
Figure 3. ADSCs secrete 100–200 nm exosomes.
(A) A phase-contrast transmission electron micrograph of purified ADSC #4-derived exosomes. Scale bar: 100 nm. (B) The exosome fractions and cell lysates of ADSCs #1 and #4 were analyzed by immunoblotting with antibodies against exosomal proteins CD63 and CD81 and cellular proteins cytochrome-c (Cyt-c) and actin (CD63 under nonreducing conditions). Equal amounts of protein from cell lysates or exosomes were used for each assay: 0.5 μg for CD63, 5 μg for CD81 and Cyt-c, and 1 μg for actin. (C, D) Size distribution of ADSC#1-derived exosomes as measured by nanoparticle tracking analysis (NTA) showed a peak at 175 nm (C), and scanning ion occlusion sensing (SIOS) showed a peak at 118.9 nm (D). (E) Yields and peak diameters of exosomes produced by ADSCs #1–4 are summarized. Protein amounts and particle numbers of harvested exosomes were determined by the Bradford method and NTA, respectively. Peak diameters were determined by NTA and SIOS. Data are the mean ± S.D. (n = 3−4).
Figure 4
Figure 4. ADSC-derived exosomes possess enzymatically active NEP.
(A) Immunoblotting for NEP of exosomes isolated from ADSCs #1–4. (B–D) NEP enzyme activity assay for ADSC-derived exosomes (#1–4). NEP enzyme activity was measured using a fluorogenic peptide substrate, Mca-RPPGFSAFK(Dnp) and NEP inhibitor thiorphan. NEP specific activity (B) was calculated by subtracting the residual fluorescence intensity measured in the presence of thiorphan (D) from the total enzyme activity measured in the absence of thiorphan (C). Addition of thiorphan sharply reduced the enzyme activity of ADSC-derived exosomes (D). (E) NEP contribution ratio for ADSC-derived exosomes calculated as the percentage ratio of NEP-specific activity rate to total activity rate. (F) NEP-specific enzyme activity levels of exosome fractions of ADSCs #1–4 were estimated from a rhNEP standard curve (Fig. 4S) and are represented as the value ng-rhNEP/μg protein (termed as NEP activity index in the diagram). N.D. indicates “not determined”.
Figure 5
Figure 5. ADSCs decrease both the extracellular and intracellular Aβ levels of N2a cells.
(A) Schematic representation of the co-culture experiments of N2a cells with ADSCs or BM-MSCs using cell culture inserts. Secreted Aβ40 (B) and Aβ42 (C) levels were measured using the collected CM in the bottom chambers by ELISA. Each value was normalized to the protein content of N2a cell lysates. Data are the mean ± S.D. (n = 4). (D) Intracellular Aβ42 levels were measured using the N2a cell lysates by ELISA. Each value was normalized to the protein content of N2a cell lysates. (E) Intracellular Aβ42 levels were compared in co-cultures of ADSCs and N2a cells in the presence and absence of thiorphan. Each value is shown as the relative level to the control. Data are the mean ± S.D. (n = 4).
Figure 6
Figure 6. ADSC-derived exosomes are incorporated into N2a cells.
(A) Top diagram shows the schematic representation of the co-culture experiements of N2a cells and ADSCs labeled with PKH67 and PKH26, respectively.Bottom diagram shows the representative image taken 24 hr after co-culture of N2a cells with ADSCs. Filled arrowheads indicate N2a cells co-stained with PKH26 and PKH67. Open arrowheads indicate PKH26 labeled ADSCs. Scale bar: 50 μm. (B) Purified ADSC exosomes or vehicle PBS(-) as a control were labeled with PKH67, and incubated with cultured N2a cells. 7 hr after incubation, some of the cells were stained green (arrowheads). After 24 hr, most N2a cells were stained green. Scale bar: 25 μm.

References

    1. Hardy J. Amyloid, the presenilins and Alzheimer's disease. Trends Neurosci. 20, 154–159 (1997). - PubMed
    1. Selkoe D. J. The cell biology of beta-amyloid precursor protein and presenilin in Alzheimer's disease. Trends Cell Biol. 8, 447–453 (1998). - PubMed
    1. Iwata N., Higuchi M. & Saido T. C. Metabolism of amyloid-beta peptide and Alzheimer's disease. Pharmacol. Ther. 108, 129–148 (2005). - PubMed
    1. Iwata N. et al. Metabolic regulation of brain Abeta by neprilysin. Science 292, 1550–1552 (2001). - PubMed
    1. Iwata N. et al. Identification of the major Abeta1-42-degrading catabolic pathway in brain parenchyma: suppression leads to biochemical and pathological deposition. Nat. Med. 6, 143–150 (2000). - PubMed

Publication types

MeSH terms