. 2013 Feb 5:14:39.
doi: 10.1186/1471-2105-14-39.

puma 3.0: improved uncertainty propagation methods for gene and transcript expression analysis

Affiliations

puma 3.0: improved uncertainty propagation methods for gene and transcript expression analysis

Xuejun Liu et al. BMC Bioinformatics. .

Abstract

Background: Microarrays have been a popular tool for gene expression profiling at genome-scale for over a decade due to the low cost, short turn-around time, excellent quantitative accuracy and ease of data generation. The Bioconductor package puma incorporates a suite of analysis methods for determining uncertainties from Affymetrix GeneChip data and propagating these uncertainties to downstream analysis. As isoform level expression profiling receives more and more interest within genomics in recent years, exon microarray technology offers an important tool to quantify expression level of the majority of exons and enables the possibility of measuring isoform level expression. However, puma does not include methods for the analysis of exon array data. Moreover, the current expression summarisation method for Affymetrix 3' GeneChip data suffers from instability for low expression genes. For the downstream analysis, the method for differential expression detection is computationally intensive and the original expression clustering method does not consider the variance across the replicated technical and biological measurements. It is therefore necessary to develop improved uncertainty propagation methods for gene and transcript expression analysis.

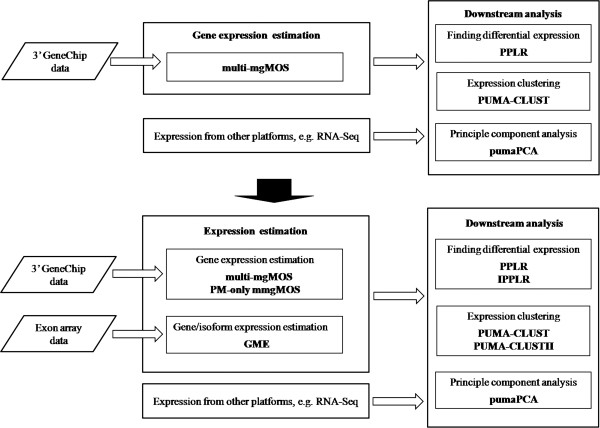
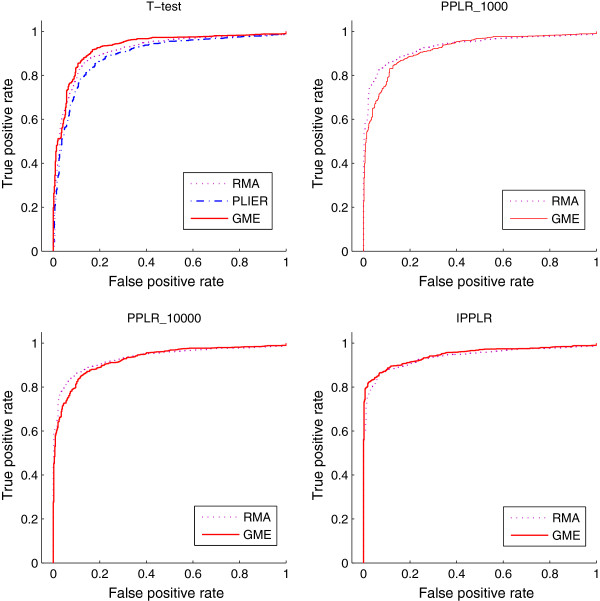
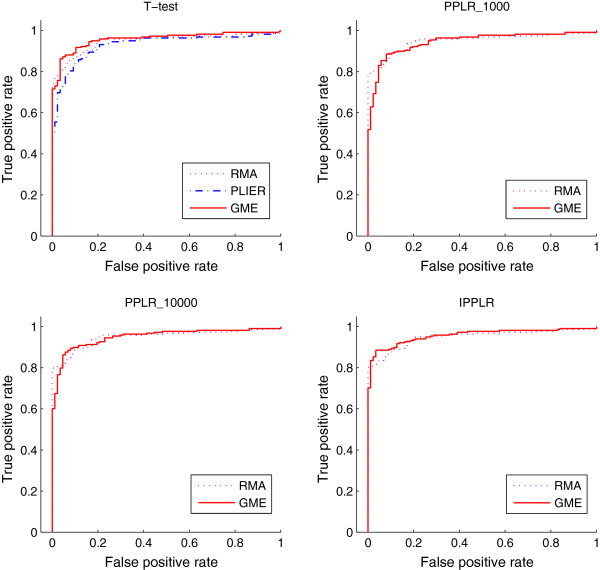
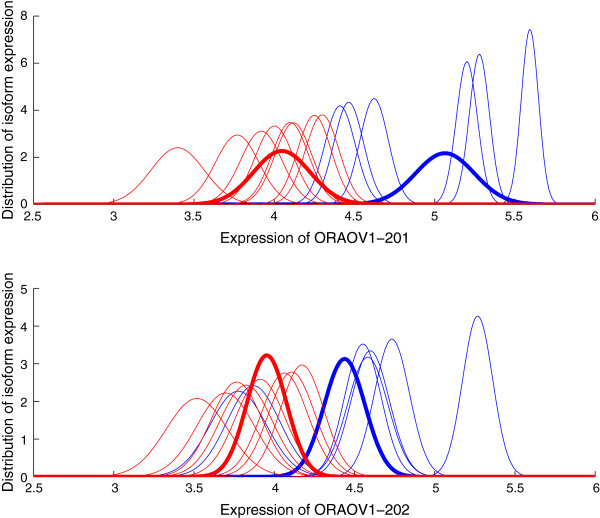
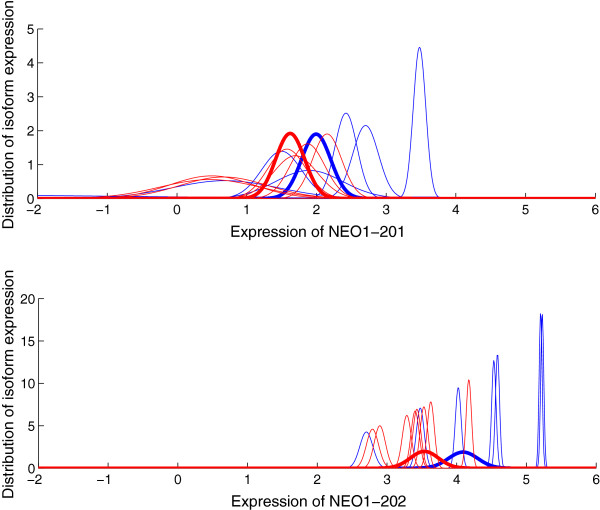
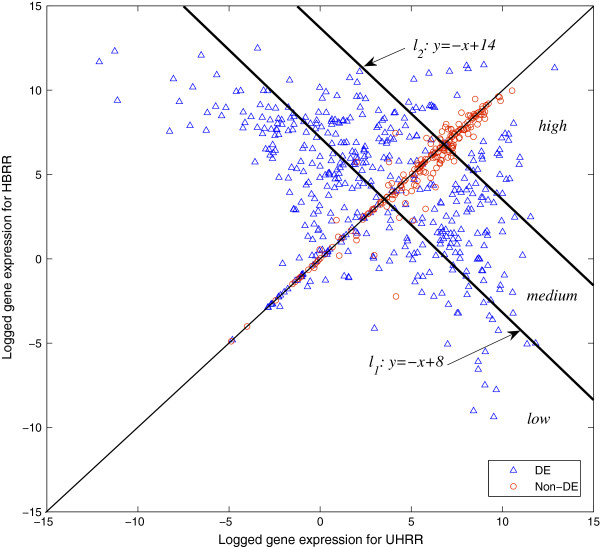
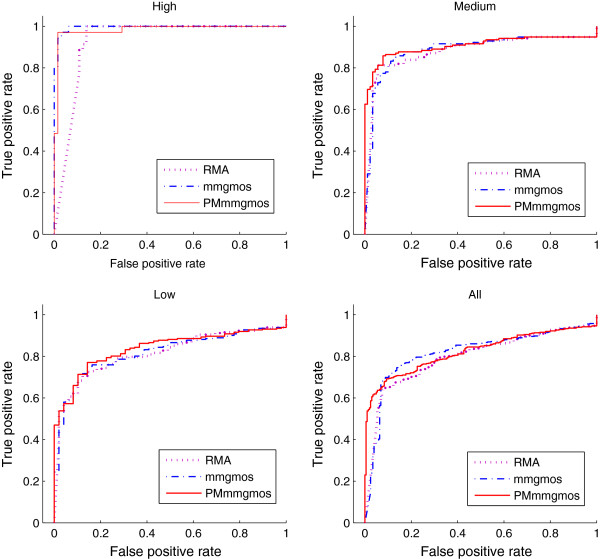
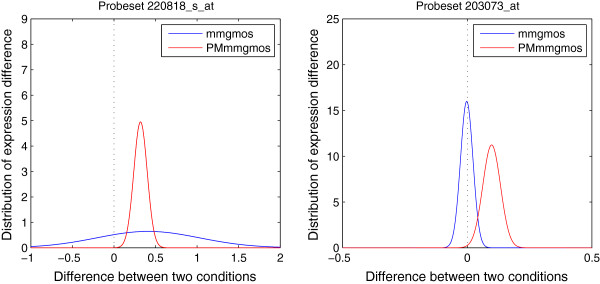
Results: We extend the previously developed Bioconductor package puma with a new method especially designed for GeneChip Exon arrays and a set of improved downstream approaches. The improvements include: (i) a new gamma model for exon arrays which calculates isoform and gene expression measurements and a level of uncertainty associated with the estimates, using the multi-mappings between probes, isoforms and genes, (ii) a variant of the existing approach for the probe-level analysis of Affymetrix 3' GeneChip data to produce more stable gene expression estimates, (iii) an improved method for detecting differential expression which is computationally more efficient than the existing approach in the package and (iv) an improved method for robust model-based clustering of gene expression, which takes technical and biological replicate information into consideration.

Conclusions: With the extensions and improvements, the puma package is now applicable to the analysis of both Affymetrix 3' GeneChips and Exon arrays for gene and isoform expression estimation. It propagates the uncertainty of expression measurements into more efficient and comprehensive downstream analysis at both gene and isoform level. Downstream methods are also applicable to other expression quantification platforms, such as RNA-Seq, when uncertainty information is available from expression measurements. puma is available through Bioconductor and can be found at http://www.bioconductor.org.


Figures

Figure 1
Figure 1
Function components of the previous and new version of puma. The upper part of the figure shows the function components of the previous version of puma package and the lower part shows the new version. After the extension and improvement, the new version covers expression analysis for 3’ GeneChip and Exon array data at both gene and isoform level.
Figure 2
Figure 2
ROC curves from different methods for 2-replicate Exon array data. The ROC curves are obtained from the average over the 5 runs each of which randomly selects two replicates. Gene expression estimation methods RMA, PLIER and GMA, are combined with different finding-DE-gene methods, t-test, PPLR and IPPLR. PLIER provides only a point estimate for gene expression and therefore is not applicable to PPLR and IPPLR. The number after PPLR indicates the sample number used in the importance sampling of the algorithm.
Figure 3
Figure 3
ROC curves from different methods for 5-replicate Exon array data. Gene expression estimation methods are combined with different finding-DE-gene methods. PLIER provides only a point estimate for gene expression and therefore is not applicable to PPLR and IPPLR. The number after PPLR indicates the sample number used in the importance sampling of the algorithm.
Figure 4
Figure 4
Distribution of isoform expression for gene ORAOV1. The distributions of the estimated isoform expression for the two alternatively spliced transcripts of gene ORAOV1 in the 15 cell lines are calculated from GME. The blue lines are for 11q13+ group and red lines for 11q13- group. The bold lines are the distributions of the mean expression for each group, obtained from PPLR. Expression is on the log scale.
Figure 5
Figure 5
Distribution of isoform expression for gene NEO1. The distributions of the estimated isoform expression for the two alternatively spliced transcripts of gene NEO1 in the 15 cell lines are calculated from GME. The blue lines are for 11q13+ group and red lines for 11q13- group. The bold lines are the distributions of the mean expression for each group, obtained from PPLR. Expression is on the log scale.
Figure 6
Figure 6
The partition of qRT-PCR validated probe-sets in H133 GeneChip dataset. Gene expression estimates are calculated from multi-mgMOS. The scatter plot is drawn with expression of HBRR sample against UHRR sample. Line l1:y=−x+8 and line l2:y=−x+14 partition the 656 qRT-PCR validated probe-sets into 3 groups, labelled as “low”, “median” and “high”.
Figure 7
Figure 7
ROC curves from different methods for U133 GeneChip data. ROC curves are calculated from different gene expression estimation methods, RMA, multi-mgMOS and PM-only multi-mgMOS, combined with PPLR for “low”, “median”, “high” and “all” groups of U133 GeneChips data.
Figure 8
Figure 8
Distribution of expression difference between two conditions for U133 GeneChip data. Probe-set 220818_s_at is a low expression DE gene and probe-set 203073_at is a relatively highly expressed non-DE gene. The blue lines stand for the distributions of expression difference between two conditions calculated from multi-mgMOS and the red lines for PM-only multi-mgMOS.

Similar articles

Cited by

References

    1. Łabaj PP, Leparc GG, E LB, Markillie LM, S WH, P KD. Characterization and improvement of RNA-Seq precision in quantitative transcript expression profiling. Bioinformatics. 2011;27(13):i383–i391. doi: 10.1093/bioinformatics/btr247. - DOI - PMC - PubMed
    1. Pearson RD, Liu X, Sanguinetti G, Milo M, D LN, Rattray M. puma: a bioconductor package for propagating uncertainty in microarray analysis. BMC Bioinformatics. 2009;10:211. doi: 10.1186/1471-2105-10-211. - DOI - PMC - PubMed
    1. Liu X, Milo M, Lawrence ND, Rattray M. A tractable probabilistic model for Affymetrix probe-level analysis across multiple chips. Bioinformatics. 2005;21:3637–3644. doi: 10.1093/bioinformatics/bti583. - DOI - PubMed
    1. Sanguinetti G, MIlo M, Rattray M, Lawrence ND. Accounting for probe-level noise in principal component analysis of mmicroarray data. Bioinformatice. 2005;21:3748–3754. doi: 10.1093/bioinformatics/bti617. - DOI - PubMed
    1. Liu X, Milo M, Lawrence ND, Rattray M. Probe-level measurement error improves accuracy in detecting differential gene expression. Bioinformatics. 2006;22:2107–2113. doi: 10.1093/bioinformatics/btl361. - DOI - PubMed

Publication types