Molecular profiling of cutaneous squamous cell carcinomas and actinic keratoses from organ transplant recipients
- PMID: 23379751
- PMCID: PMC3570297
- DOI: 10.1186/1471-2407-13-58
Molecular profiling of cutaneous squamous cell carcinomas and actinic keratoses from organ transplant recipients
Abstract
Background: The risk of developing cutaneous squamous cell carcinoma (SCC) is markedly increased in organ transplant recipients (OTRs) compared to the normal population. Next to sun exposure, the immunosuppressive regimen is an important risk factor for the development of SCC in OTRs. Various gene mutations (e.g. TP53) and genetic alterations (e.g. loss of CDKN2A, amplification of RAS) have been found in SCCs. The aim of this genome-wide study was to identify pathways and genomic alterations that are consistently involved in the formation of SCCs and their precursor lesions, actinic keratoses (AKs).
Methods: To perform the analysis in an isogenic background, RNA and DNA were isolated from SCC, AK and normal (unexposed) epidermis (NS) from each of 13 OTRs. Samples were subjected to genome-wide expression analysis and genome SNP analysis using Illumina's HumanWG-6 BeadChips and Infinium II HumanHap550 Genotyping BeadChips, respectively. mRNA expression results were verified by quantitative PCR.
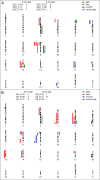
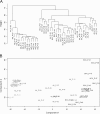
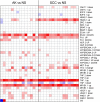
Results: Hierarchical cluster analysis of mRNA expression profiles showed SCC, AK and NS samples to separate into three distinct groups. Several thousand genes were differentially expressed between epidermis, AK and SCC; most upregulated in SCCs were hyperproliferation related genes and stress markers, such as keratin 6 (KRT6), KRT16 and KRT17. Matching to oncogenic pathways revealed activation of downstream targets of RAS and cMYC in SCCs and of NFκB and TNF already in AKs. In contrast to what has been reported previously, genome-wide SNP analysis showed very few copy number variations in AKs and SCCs, and these variations had no apparent relationship with observed changes in mRNA expression profiles.
Conclusion: Vast differences in gene expression profiles exist between SCC, AK and NS from immunosuppressed OTRs. Moreover, several pathways activated in SCCs were already activated in AKs, confirming the assumption that AKs are the precursor lesions of SCCs. Since the drastic changes in gene expression appeared unlinked to specific genomic gains or losses, the causal events driving SCC development require further investigation. Other molecular mechanisms, such as DNA methylation or miRNA alterations, may affect gene expression in SCCs of OTRs. Further study is required to identify the mechanisms of early activation of NFκB and TNF, and to establish whether these pathways offer a feasible target for preventive intervention among OTRs.
Figures


References
-
- Bouwes Bavinck JN, Hardie DR, Green A, Cutmore S, MacNaught A, O’Sullivan B, Siskind V, van ver Woude FJ, Hardie IR. The risk of skin cancer in renal transplant recipients in Queensland, Australia. A follow-up study. Transplantation. 1996;61:715–721. doi: 10.1097/00007890-199603150-00008. - DOI - PubMed
-
- Fortina AB, Piaserico S, Caforio AL, Abeni D, Alaibac M, Angelini A, Iliceto S, Peserico A. Immunosuppressive level and other risk factors for basal cell carcinoma and squamous cell carcinoma in heart transplant recipients. Arch Dermatol. 2004;140:1079–1085. doi: 10.1001/archderm.140.9.1079. - DOI - PubMed
-
- Glover MT, Deeks JJ, Raftery MJ, Cunningham J, Leigh IM. Immunosuppression and risk of non-melanoma skin cancer in renal transplant recipients. Lancet. 1997;349:398. - PubMed
Publication types
MeSH terms
Substances
LinkOut - more resources
Full Text Sources
Other Literature Sources
Medical
Molecular Biology Databases
Research Materials
Miscellaneous

