. 2013 Feb;19(1):201-12.
doi: 10.1017/S1431927612014080.

Intravital confocal and two-photon imaging of dual-color cells and extracellular matrix mimics

Affiliations

Intravital confocal and two-photon imaging of dual-color cells and extracellular matrix mimics

Ufuk Bal et al. Microsc Microanal. 2013 Feb.

Abstract

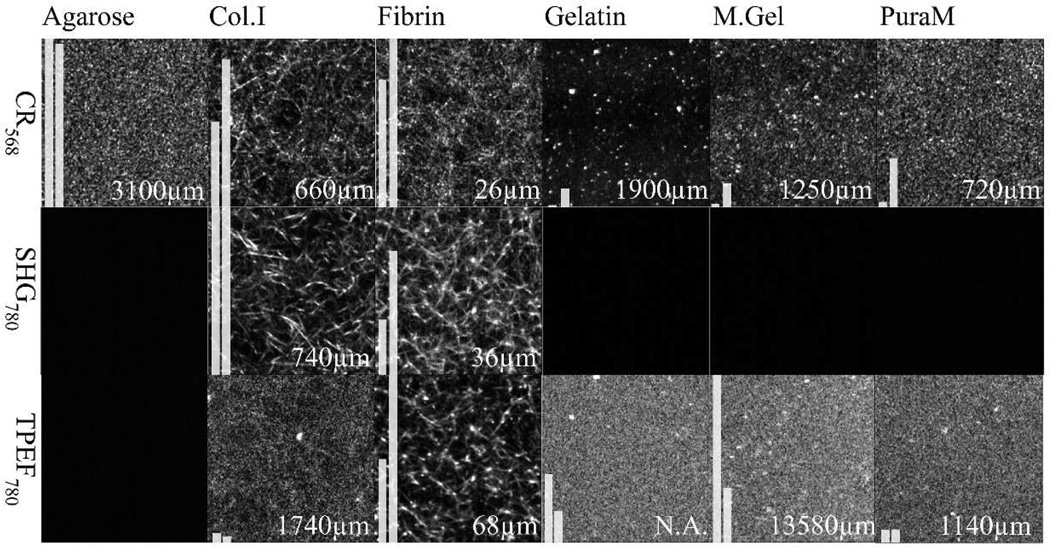
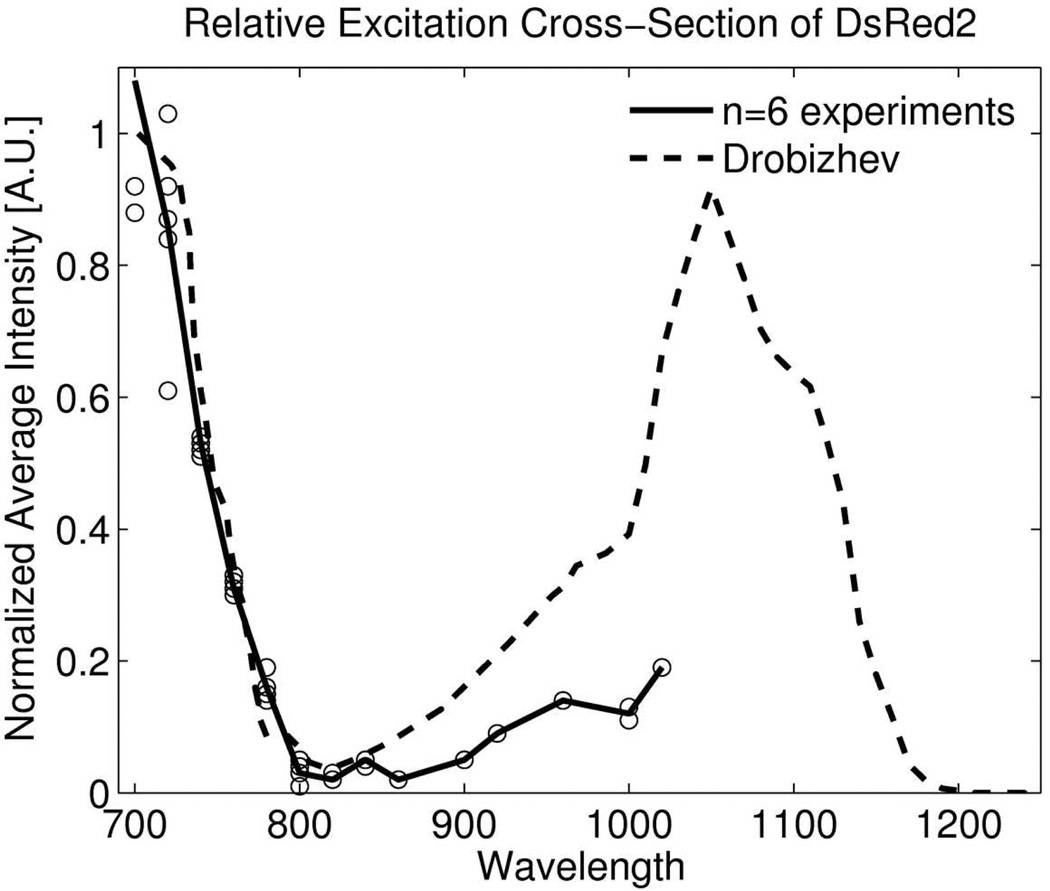
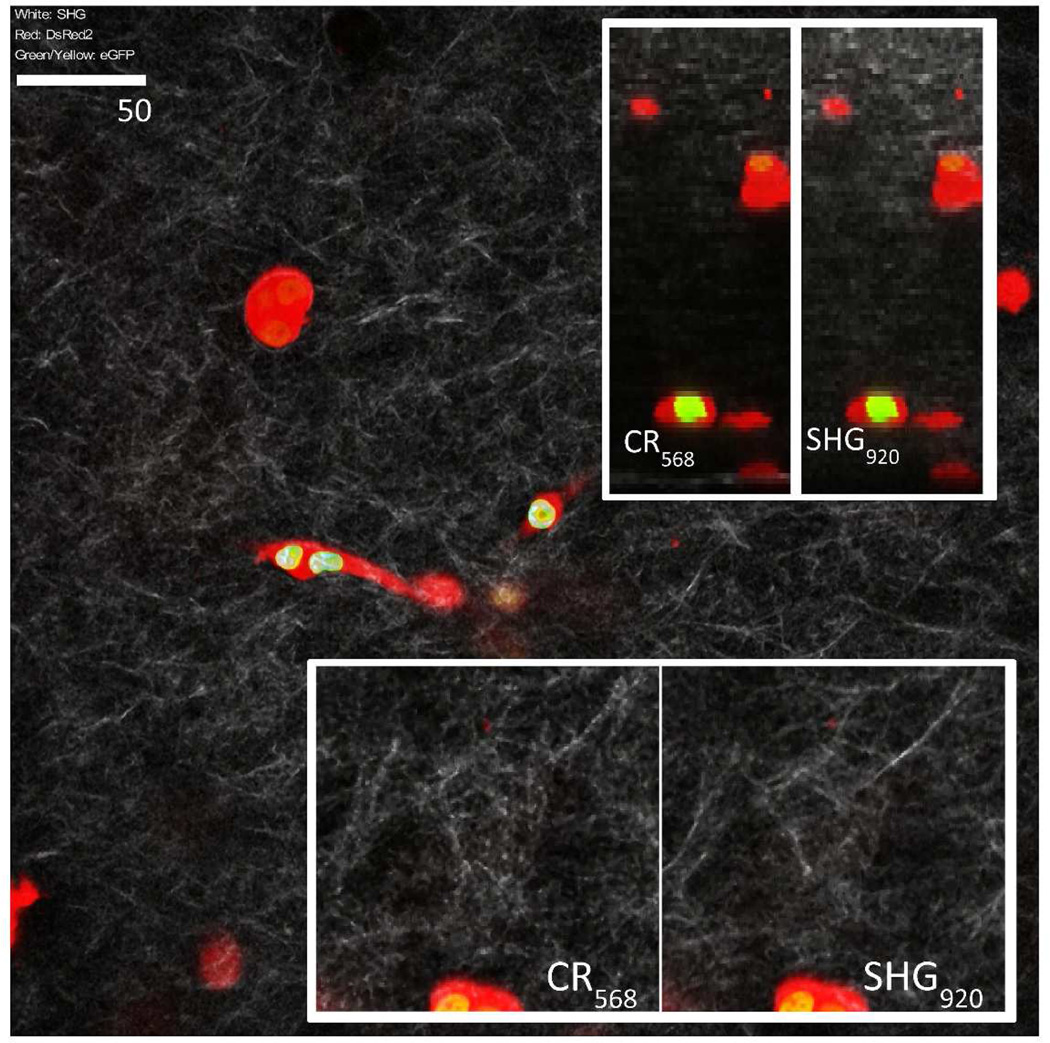
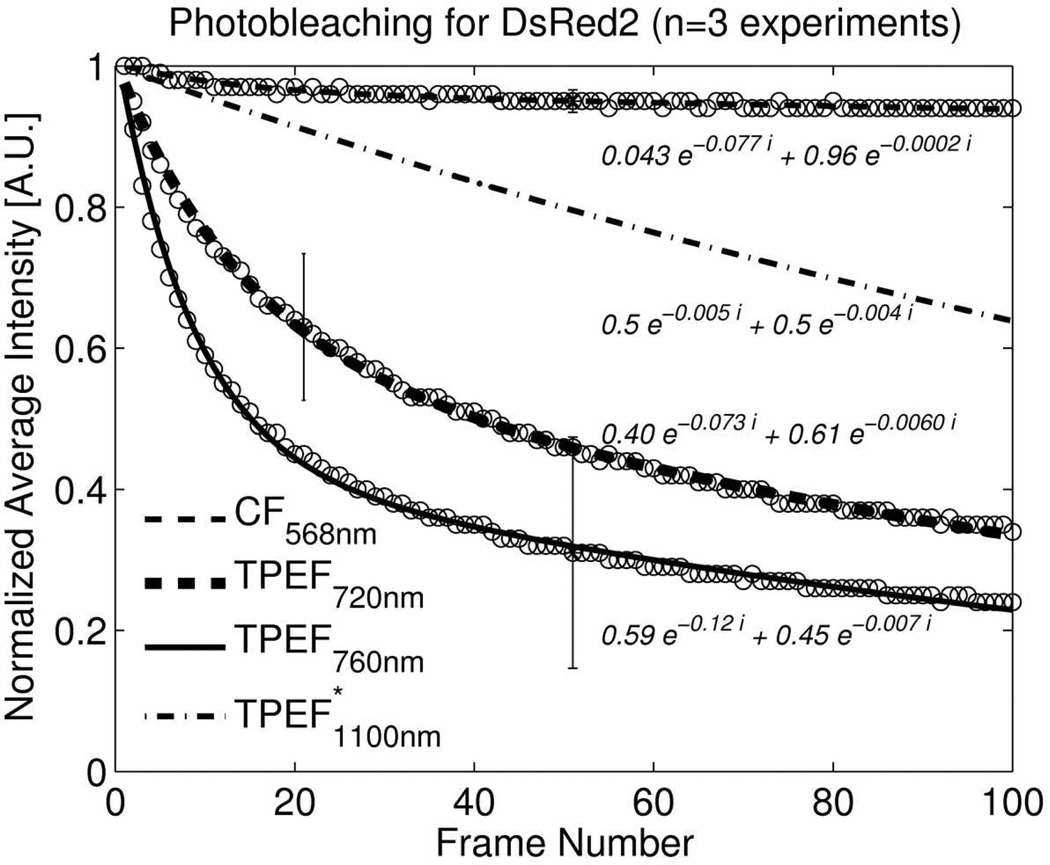
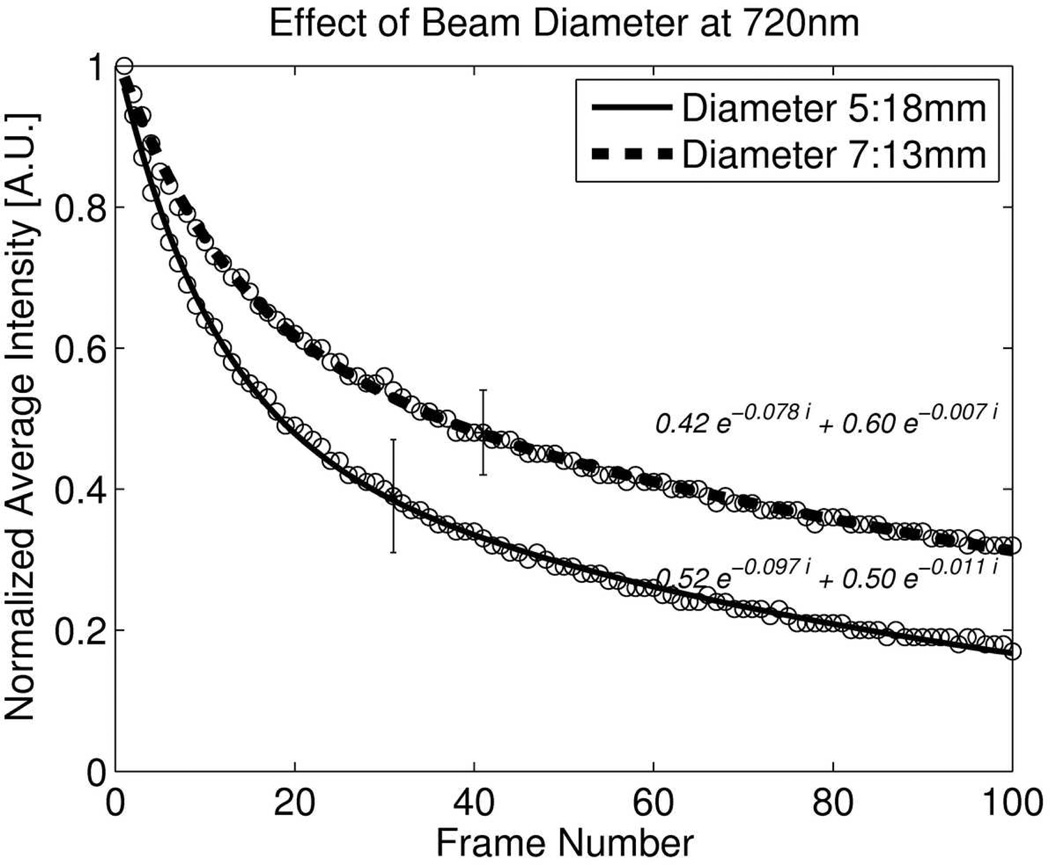
We report our efforts in identifying optimal scanning laser microscope parameters to study cells in three-dimensional culture. For this purpose we studied contrast of extracellular matrix (ECM) mimics, as well as signal attenuation, and bleaching of red and green fluorescent protein labeled cells. Confocal backscattering, second harmonic generation (SHG), and autofluorescence were sources of contrast in ECM mimics. All common ECM mimics exhibit contrast observable with confocal reflectance microscopy. SHG imaging on collagen I based hydrogels provides high contrast and good optical penetration depth. Agarose is a useful embedding medium because it allows for large optical penetration and exhibits minimal autofluorescence. We labeled breast cancer cells' outline with DsRed2 and nucleus with enhanced green fluorescent protein (eGFP). We observed significant difference both for the bleaching rates of eGFP and DsRed2 where bleaching is strongest during two-photon excitation (TPE) and smallest during confocal imaging. But for eGFP the bleaching rate difference is smaller than for DsRed2. After a few hundred microns depth in a collagen I hydrogel, TPE fluorescence of DsRed2 becomes twice as strong compared to confocal imaging. In fibrin and agarose gels, the imaging depth will need to be beyond 1 mm to notice a TPE advantage.


Figures

Figure 1
Figure 1
a. Schematic diagram of the two-photon unit of the microscope. After expanding the beam in a telescope to match the back aperture of the microscope objective the laser beam passes the scan unit, is focused by the scan lens on an intermediate image plane and re-collimated by the field lens to match the infinity corrected microscope optics. Fluorescence and SHG is collected by three PMTs in the microscope’s non-descanned detection port. Emission and SHG wavelengths are selected by appropriate bandpass and dichroic filters. b. Schematic diagram of the confocal unit of the microscope. The confocal illumination laser enters the unit through a fiberoptic port, is collimated and passes polarization optics which converts linear polarization to circular polarization. After reflecting on a dichroic mirror the beam path is merged with the two-photon system by two beam steering mirrors. Reflected light is separated from the illumination light through a polarizing beam splitter cube and imaged on the PMT through a confocal pinhole. Fluorescence passes the dichroic mirror and is imaged similarly on a PMT.
Figure 1
Figure 1
a. Schematic diagram of the two-photon unit of the microscope. After expanding the beam in a telescope to match the back aperture of the microscope objective the laser beam passes the scan unit, is focused by the scan lens on an intermediate image plane and re-collimated by the field lens to match the infinity corrected microscope optics. Fluorescence and SHG is collected by three PMTs in the microscope’s non-descanned detection port. Emission and SHG wavelengths are selected by appropriate bandpass and dichroic filters. b. Schematic diagram of the confocal unit of the microscope. The confocal illumination laser enters the unit through a fiberoptic port, is collimated and passes polarization optics which converts linear polarization to circular polarization. After reflecting on a dichroic mirror the beam path is merged with the two-photon system by two beam steering mirrors. Reflected light is separated from the illumination light through a polarizing beam splitter cube and imaged on the PMT through a confocal pinhole. Fluorescence passes the dichroic mirror and is imaged similarly on a PMT.
Figure 2
Figure 2
Summary of ECM Mimic imaging. All images are 50×50 micron square in size and imaged with a precision of 474×474 pixel2. The first row illustrates confocal reflectance images of gels at 568nm illumination. Second and third rows show the second harmonic generation (SHG) and two photon excited fluorescence (TPEF) images of the gels (laser at 780nm). The first bar in each image illustrates average intensity and the second bar illustrates image contrast factor of images. Numbers on the images indicates depth where intensity decays to 1/e (37%, optical penetration). Images below an intensity threshold are shown black. For display purpose, all images were filtered and contrast adjusted (median 2×2, 1% high/low eliminated) while calculations were performed on images having only sensor background subtracted.
Figure 3
Figure 3
Relative excitation cross-section of DsRed2. An excitation wavelength scan was performed using TPEF microscopy on DsRed2. Our results are consistent with literature in the lower wavelength range.
Figure 4
Figure 4
3D culture of dual colored cells in collagen ECM mimic. Nucleus exhibits eGPF fluorescence at 920nm excitation and cells were outlined with confocal DsRed2 imaging at 568nm excitation. Image stacks were filtered and contrast adjusted (median 3×3). Image pairs illustrate the difference between confocal reflectance and SHG imaging. Images at the top right illustrate cross sections of the image stacks down to a depth of 180 microns. Each frame is 400×400 micron square in size and imaged with a precision of 1021×1021 pixel2. Inserts at the bottom are a closer view (2×) to illustrate the contrast difference in confocal reflectance and SHG imaging of collagen fibers.
Figure 5
Figure 5
a: Intensity ratios of confocal fluorescence vs. two-photon excited fluorescence for DsRed2 as a function of penetration depth. Attenuation difference is 21cm−1 giving TPEF an intensity advantage of ~2 at a depth of 320 microns. b: Intensity ratios of confocal fluorescence vs. two-photon excited fluorescence for eGFP as a function of penetration depth (only cells 100 micron below the sample surface were analyzed). Data was obtained on an LSM510 with 40× NA:1.0 WI objective lens. TPEF signal advantage is approximately twice that of DsRed2.
Figure 5
Figure 5
a: Intensity ratios of confocal fluorescence vs. two-photon excited fluorescence for DsRed2 as a function of penetration depth. Attenuation difference is 21cm−1 giving TPEF an intensity advantage of ~2 at a depth of 320 microns. b: Intensity ratios of confocal fluorescence vs. two-photon excited fluorescence for eGFP as a function of penetration depth (only cells 100 micron below the sample surface were analyzed). Data was obtained on an LSM510 with 40× NA:1.0 WI objective lens. TPEF signal advantage is approximately twice that of DsRed2.
Figure 6
Figure 6
a: Photobleaching of DsRed2 measured as decrease in emission intensity during consecutive scanning for confocal (568nm, 9.2µW at sample) and two photon imaging (720nm, 22mW, 760nm 44mW). Settings resulted in same average intensity on same type of PMT sensor. Data at 1100nm was taken from Andresen et al(Andresen, et al., 2009) and scaled so that our and their data at 760nm matched. The samples were subjected to 100 consecutive scans. For illustration, emission intensities were normalized according to the intensities obtained in the first frame. All curves were fitted to two-exponential functions. b: Photobleaching of eGFP for confocal (488nm, 102 µW) and two photon imaging (920nm, 22mW). Data was obtained on LSM510, 40× NA:1.0 WI. c: Effect of two different beam diameters on DsRed2 bleaching at 720nm.
Figure 6
Figure 6
a: Photobleaching of DsRed2 measured as decrease in emission intensity during consecutive scanning for confocal (568nm, 9.2µW at sample) and two photon imaging (720nm, 22mW, 760nm 44mW). Settings resulted in same average intensity on same type of PMT sensor. Data at 1100nm was taken from Andresen et al(Andresen, et al., 2009) and scaled so that our and their data at 760nm matched. The samples were subjected to 100 consecutive scans. For illustration, emission intensities were normalized according to the intensities obtained in the first frame. All curves were fitted to two-exponential functions. b: Photobleaching of eGFP for confocal (488nm, 102 µW) and two photon imaging (920nm, 22mW). Data was obtained on LSM510, 40× NA:1.0 WI. c: Effect of two different beam diameters on DsRed2 bleaching at 720nm.
Figure 7
Figure 7
Comparison of in plane and out of plane photobleaching. Out of plane photo bleaching is measured on a stack of 41 images separated by 1 micron. First bars of the two groups indicate intensity decrease after 40 consecutively measured frames at a fixed depth location (in plane) and second bar illustrates intensity decrease for the hypothetical case of maximum out of plane bleaching when the bleaching rate of the neighboring planes would be the same as the one in the currently imaged planed which in this example is equivalent to 40×41 exposures of a single plane. Third and fourth bars indicate intensities at the bottom and top of stacks after 40 consecutive stack measurements. Contrary to TPE, OPE has out of focal plane photobleaching and bleaching at the top of the stack is increased.

References

    1. Andresen V, Alexander S, Heupel WM, Hirschberg M, Hoffman RM, Friedl P. Infrared multiphoton microscopy: subcellular-resolved deep tissue imaging. Curr Opin Biotechnol. 2009;20(1):54–62. - PubMed
    1. Atala A, Lanza RP. Methods of tissue engineering. San Diego, CA: Academic Press; 2001.
    1. Baird IS, Yau AY, Mann BK. Mammalian cell-seeded hydrogel microarrays printed via dip-pin technology. Biotechniques. 2008;44(2):249–256. - PubMed
    1. Bjorkoy G, Lamark T, Brech A, Outzen H, Perander M, Overvatn A, Stenmark H, Johansen T. p62/SQSTM1 forms protein aggregates degraded by autophagy and has a protective effect on huntingtin-induced cell death. J Cell Biol. 2005;171(4):603–614. - PMC - PubMed
    1. Blab GA, Lommerse PHM, Cognet L, Harms GS, Schmidt T. Two-photon excitation action cross-sections of the autofluorescent proteins. Chemical Physics Letters. 2001;350(1–2):71–77.

Publication types

MeSH terms

Substances