. 2013 Jun:73:80-94.
doi: 10.1016/j.neuroimage.2013.01.054. Epub 2013 Feb 4.

Distinct brain mechanisms for conscious versus subliminal error detection

Affiliations

Distinct brain mechanisms for conscious versus subliminal error detection

Lucie Charles et al. Neuroimage. 2013 Jun.

Abstract

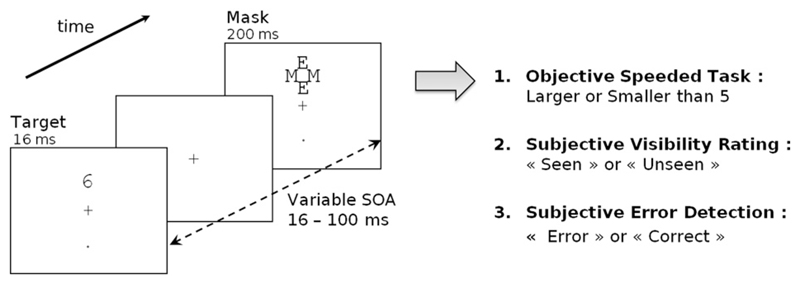
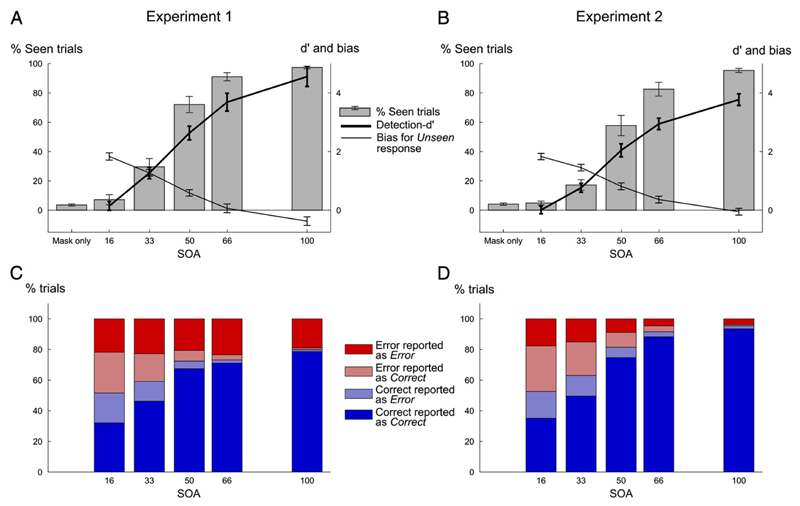
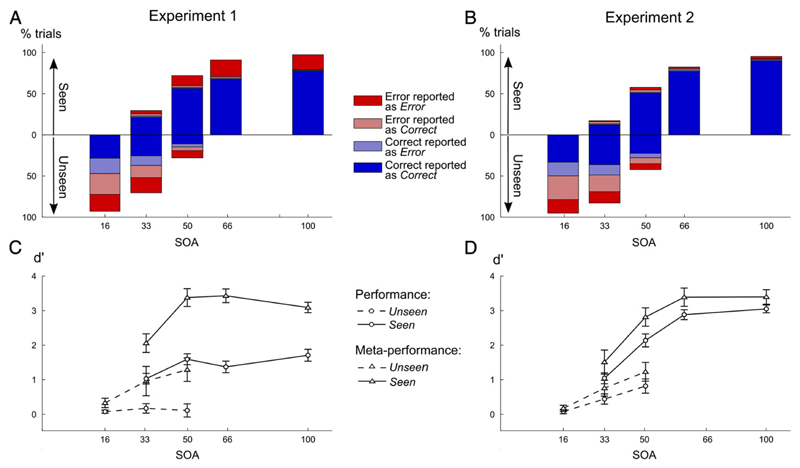
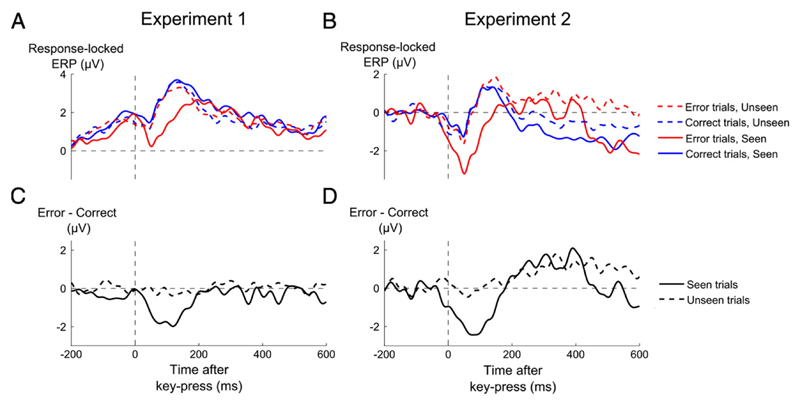
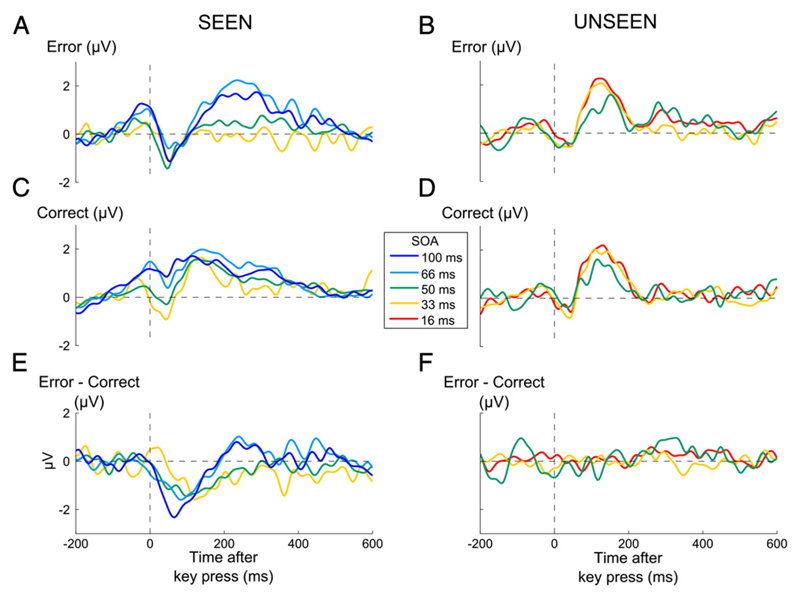
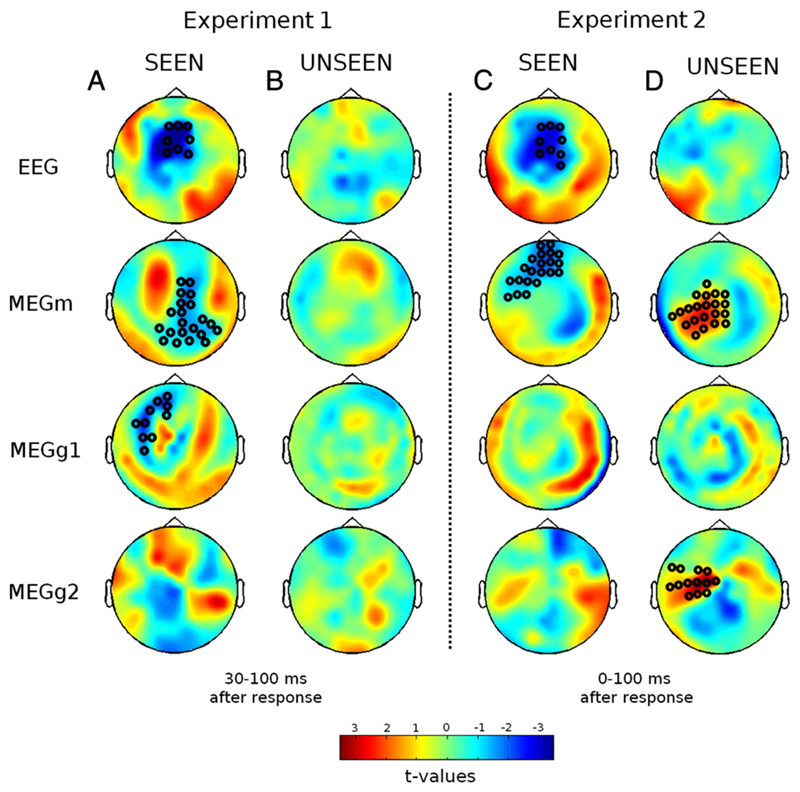
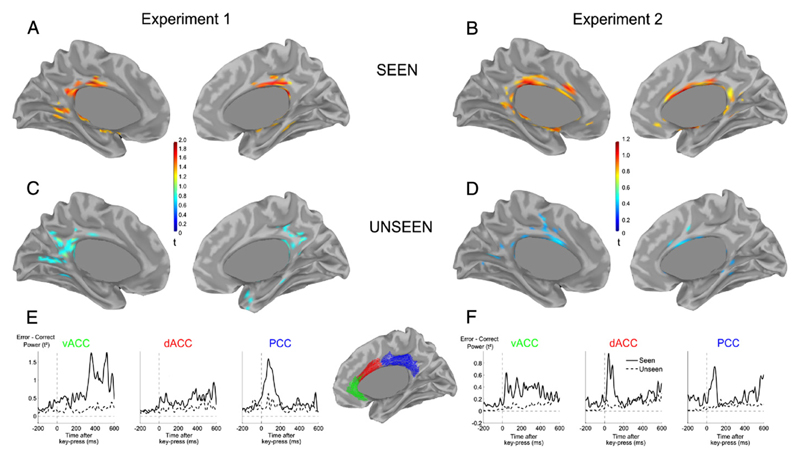
Metacognition, the ability to monitor one's own cognitive processes, is frequently assumed to be univocally associated with conscious processing. However, some monitoring processes, such as those associated with the evaluation of one's own performance, may conceivably be sufficiently automatized to be deployed non-consciously. Here, we used simultaneous electro- and magneto-encephalography (EEG/MEG) to investigate how error detection is modulated by perceptual awareness of a masked target digit. The Error-Related Negativity (ERN), an EEG component occurring ~100 ms after an erroneous response, was exclusively observed on conscious trials: regardless of masking strength, the amplitude of the ERN showed a step-like increase when the stimulus became visible. Nevertheless, even in the absence of an ERN, participants still managed to detect their errors at above-chance levels under subliminal conditions. Error detection on conscious trials originated from the posterior cingulate cortex, while a small response to non-conscious errors was seen in dorsal anterior cingulate. We propose the existence of two distinct brain mechanisms for metacognitive judgements: a conscious all-or-none process of single-trial response evaluation, and a non-conscious statistical assessment of confidence.


Figures

Fig. 1
Fig. 1
Experimental design: On each trial, a number was presented for 16 ms at one of two possible locations (top or bottom). It was followed by a mask composed of a fixed array of letters centered on the target location. The delay between target onset and mask onset (SOA) varied randomly across trials (16, 33, 50, 66 or 100 ms). In one sixth of the trials, the mask was presented alone (mask only condition). Participants first performed an objective forced-choice number comparison task where they decided whether the number was smaller or larger than 5. In experiment 1, the response had to be made in less than 550 ms, otherwise a negative sound was emitted. In experiment 2, participants were simply instructed to respond as fast as they could while maintaining accuracy. Then, on each trial, participants performed two subjective tasks. First they evaluated the subjective visibility of the target by choosing between the words “Seen” and “Unseen”, displayed randomly either left or right of fixation. Second, they evaluated their own performance in the primary number comparison task by choosing between the words “Correct” and “Error”, again displayed randomly either left or right.
Fig. 2
Fig. 2
Visibility and performance results according to SOA for experiment 1 (left column) and 2 (right column). (A–B) Visibility ratings, expressed as the proportion of seen responses (left axis ranging from 0 to 100%) as a function of SOA. The thick line represents detection-d′ values (right axis, ranging from 0 to 4) while the thin line represents response bias towards unseen response (same scale as detection-d′), for each SOA. (C-D) Percentage of each category of trials according to actual objective performance and subjective report of performance (Error trials correctly classified as Error in dark red, Correct trials correctly classified as Correct in dark blue, Error trials incorrectly classified as Correct in light red and Correct trials incorrectly classified as Error in light blue), for each SOA.
Fig. 3
Fig. 3
Performance and meta-performance according to visibility and SOA in both experiments (left column, experiment 1; right column, experiment 2). (A–B) Proportions of unseen (below midline) and seen trials (above midline) were computed for each SOA. For each type of trials and each SOA, the relative percentage of each category of trials was derived according to objective performance and subjective report of performance (same color code as in Fig. 2). (C-D) Unbiased measures of performance (d′, circles) and meta-performance (meta-d′, triangles) were computed separately for seen (solid line) and unseen (dashed-line) trials and each SOA value. All error-bars represent standard error.
Fig. 4
Fig. 4
Time courses of event-related potentials as a function of objective performance and visibility. (A,B) Grand-average event-related potentials (ERPs) recorded from a cluster of central electrodes (FC1, FC2, C1, Cz, C2), sorted as a function of whether performance was erroneous (red lines) or correct (blue lines), and whether the target was seen (solid lines) or unseen trials (dashed lines), for experiment 1 (A) and experiment 2 (B). (C,D) Difference waveforms of error minus correct trials, separately for seen (solid line) and unseen (dashed line) trials.
Fig. 5
Fig. 5
Time courses of event-related potentials as a function of SOA and objective performance for seen and unseen trials. (A–D) Grand-average event-related potentials (ERPs) by SOA condition for error (top raw, A and B) and correct (middle raw, C and D) trials in seen (left column, A and C) and unseen (right column, B and D) conditions for experiment 1 on a cluster of central electrodes (FC1, FC2, C1, Cz, C2). (E,F) Difference waveforms of error minus correct for seen (solid line) and unseen (dashed line) trials, by SOA. Due to reduced trial numbers, only the shortest SOA (16, 33 and 50) ms are presented for unseen trials while only longer SOAs (33 ms, 50 ms, 66 ms and 100 ms) are included for seen trials.
Fig. 6
Fig. 6
Error-related MEEG topographies as a function of target visibility. Each plot depicts the scalp topography of the t-value for a difference between correct and error trials, averaged across a 30–100 ms time window for experiment 1 and 0–100 ms for experiment 2 following the motor response, separately for each type of sensors (EEG, magnetometers [MEGm], longitudinal gradiometers [MEGg1], latitudinal gradiometers [MEGg2]) and for the seen and unseen trials, in experiments 1 (A) and 2 (B). Black circles indicate sensors belonging to a spatiotemporal cluster showing a significant difference (p < 0.025) between error and correct conditions using a Monte-Carlo permutation test.
Fig. 7
Fig. 7
Difference of source estimates between error and correct MEEG signals. (A–D) View of the medial surface of the left and right hemispheres, for experiment 1 (A,C) and experiment 2 (B,D), for seen (A–B) and unseen (C–D) trials. Data are thresholded at 66% of maximum activity within each condition. Brain activity was averaged in a 30–100 ms time-window for experiment 1 (A,C) and 0–100 ms for experiment 2 (B,D). (E–F) Time-courses of brain activity in three bilateral regions of interest located in ventral Anterior Cingulate Cortex (vACC), dorsal Anterior Cingulate Cortex (dACC) and Posterior Cingulate Cortex (PCC), for experiment 1 (E) and experiment (2), for seen (solid-line) and unseen (dashed-line) trials. Values correspond to instantaneous power in the region of interest (average, across vertices, of the square current density t-maps).

References

    1. Agam Y, Hamalainen M, Lee ACH, Dyckman KA, Friedman JS, Isom M, Makris N, Manoach DS. Multimodal neuroimaging dissociates hemodynamic and electrophysiological correlates of error processing. Proc Natl Acad Sci. 2011;108:17556–17561. - PMC - PubMed
    1. Alexander WH, Brown JW. Medial prefrontal cortex as an action-outcome predictor. Nat Neurosci. 2011;14:1338–1344. - PMC - PubMed
    1. Aly M, Yonelinas AP. Bridging consciousness and cognition in memory and perception: evidence for both state and strength processes. PLoS One. 2012;7:e30231. - PMC - PubMed
    1. Baayen RH, Davidson DJ, Bates DM. Mixed-effects modeling with crossed random effects for subjects and items. J Mem Lang. 2008;59:390–412.
    1. Bernstein PS, Scheffers MK, Coles MGH. “Where did I go wrong?” A psychophysiological analysis of error detection. J Exp Psychol Hum Percept Perform. 1995;21:1312–1322. - PubMed

Publication types