

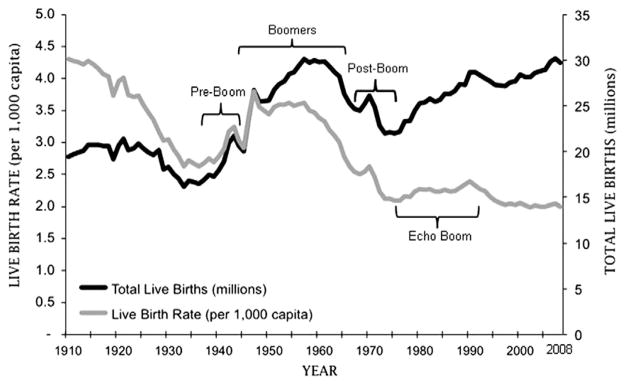
Aging baby boomers and the rising cost of chronic back pain: secular trend analysis of longitudinal Medical Expenditures Panel Survey data for years 2000 to 2007
- PMID: 23380209
- PMCID: PMC3596008
- DOI: 10.1016/j.jmpt.2012.12.001
Aging baby boomers and the rising cost of chronic back pain: secular trend analysis of longitudinal Medical Expenditures Panel Survey data for years 2000 to 2007
Abstract
Objectives: The purposes of this study were to analyze data from the longitudinal Medical Expenditures Panel Survey (MEPS) to evaluate the impact of an aging population on secular trends in back pain and chronicity and to provide estimates of treatment costs for patients who used only ambulatory services.
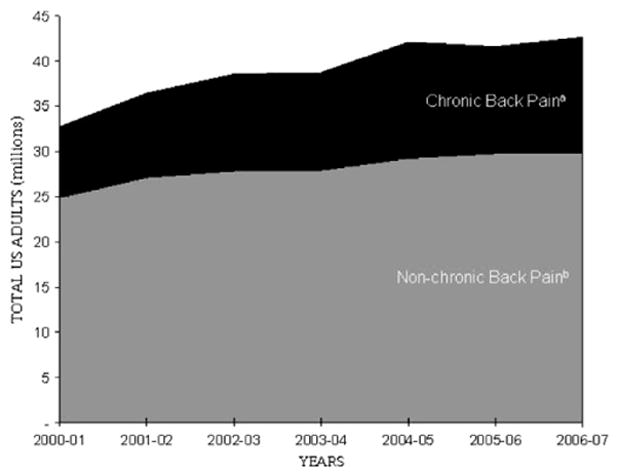
Methods: Using the MEPS 2-year longitudinal data for years 2000 to 2007, we analyzed data from all adult respondents. Of the total number of MEPS respondent records analyzed (N = 71,838), we identified 12,104 respondents with back pain and further categorized 3842 as chronic cases and 8262 as nonchronic cases.
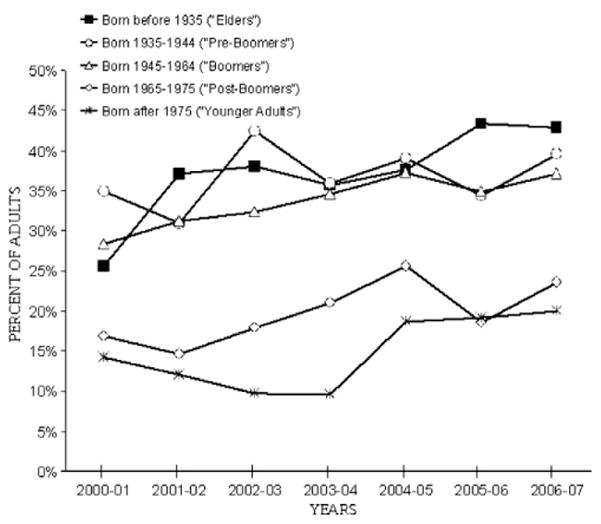
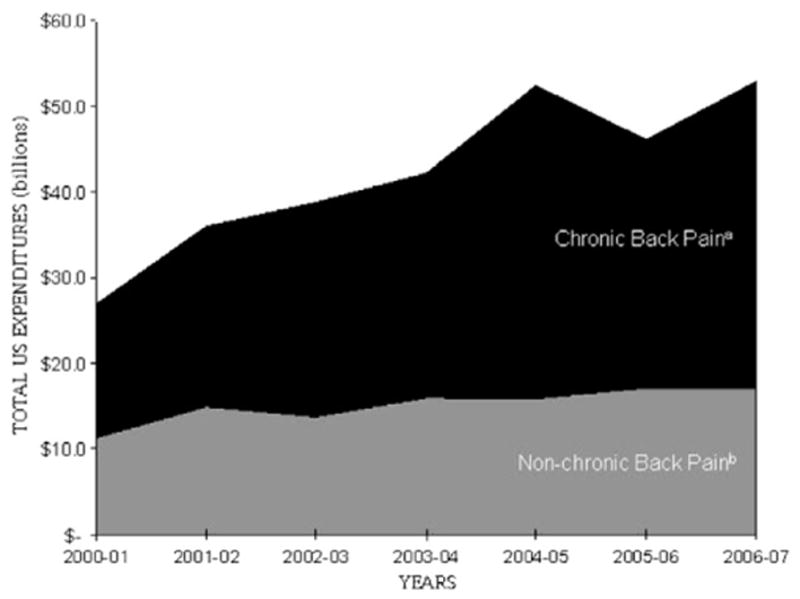
Results: Secular trends from the MEPS data indicate that the prevalence of back pain has increased by 29%, whereas chronic back pain increased by 64%. The average age among all adults with back pain increased from 45.9 to 48.2 years; the average age among adults with chronic back pain increased from 48.5 to 52.2 years. Inflation-adjusted (to 2010 dollars) biennial expenditures on ambulatory services for chronic back pain increased by 129% over the same period, from $15.6 billion in 2000 to 2001 to $35.7 billion in 2006 to 2007.
Conclusion: The prevalence of back pain, especially chronic back pain, is increasing. To the extent that the growth in chronic back pain is caused, in part, by an aging population, the growth will likely continue or accelerate. With relatively high cost per adult with chronic back pain, total expenditures associated with back pain will correspondingly accelerate under existing treatment patterns. This carries implications for prioritizing health policy, clinical practice, and research efforts to improve care outcomes, costs, and cost-effectiveness and for health workforce planning.
Copyright © 2013 National University of Health Sciences. Published by Mosby, Inc. All rights reserved.
Conflict of interest statement
Potential Conflicts of Interest
Miron Stano contributed expertise in health economics and econometrics to this research involving analyses of MEPS data. As an economist, Dr Stano has served as an expert witness in antitrust cases within the health care sector. Dr Stano reports no conflict between his service as an expert witness and his work on this research of MEPS data.
Figures
References
-
- Population Profile of the United States. U.S. Department of Commerce; 2010. [Accessed January 25, 2011.]. Available at: http://www.census.gov/population/www/pop-profile/natproj.html.
-
- Jones L. Great Expectations: America and the Baby Boom Generation. New York: Coward, McCann and Geoghegan; 1980.
-
- Dagenais S, Caro J, Haldeman S. A systematic review of low back pain cost of illness studies in the United States and internationally. Spine J. 2008;8:8–20. - PubMed
-
- Martin BI, Deyo RA, Mirza SK, et al. Expenditures and health status among adults with back and neck problems. JAMA. 2008;299:656–64. - PubMed
-
- Weiner DK, Kim YS, Bonino P, Wang T. Low back pain in older adults: are we utilizing healthcare resources wisely? Pain Med. 2006;7:143–50. - PubMed
Publication types
MeSH terms
Grants and funding
LinkOut - more resources
Full Text Sources
Other Literature Sources
Medical
