. 2013 Feb 5;158(3):145-53.
doi: 10.7326/0003-4819-158-3-201302050-00003.

Comparative effectiveness of alternative prostate-specific antigen--based prostate cancer screening strategies: model estimates of potential benefits and harms

Affiliations

Comparative effectiveness of alternative prostate-specific antigen--based prostate cancer screening strategies: model estimates of potential benefits and harms

Roman Gulati et al. Ann Intern Med. .

Abstract

Background: The U.S. Preventive Services Task Force recently concluded that the harms of existing prostate-specific antigen (PSA) screening strategies outweigh the benefits.

Objective: To evaluate comparative effectiveness of alternative PSA screening strategies.

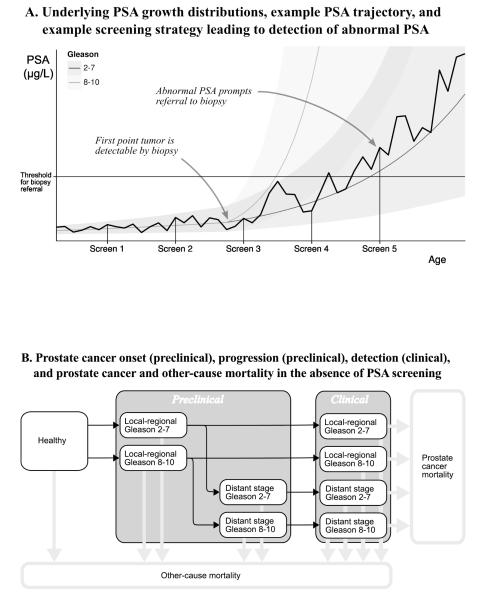
Design: Microsimulation model of prostate cancer incidence and mortality quantifying harms and lives saved for alternative PSA screening strategies.

Data sources: National and trial data on PSA growth, screening and biopsy patterns, incidence, treatment distributions, treatment efficacy, and mortality.

Target population: A contemporary cohort of U.S. men.

Time horizon: Lifetime.

Perspective: Societal.

Intervention: 35 screening strategies that vary by start and stop ages, screening intervals, and thresholds for biopsy referral.

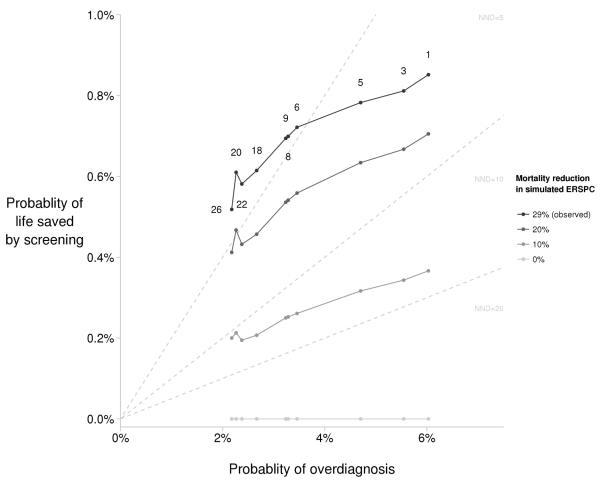
Outcome measures: PSA tests, false-positive test results, cancer detected, overdiagnoses, prostate cancer deaths, lives saved, and months of life saved.

Results of base-case analysis: Without screening, the risk for prostate cancer death is 2.86%. A reference strategy that screens men aged 50 to 74 years annually with a PSA threshold for biopsy referral of 4 µg/L reduces the risk for prostate cancer death to 2.15%, with risk for overdiagnosis of 3.3%. A strategy that uses higher PSA thresholds for biopsy referral in older men achieves a similar risk for prostate cancer death (2.23%) but reduces the risk for overdiagnosis to 2.3%. A strategy that screens biennially with longer screening intervals for men with low PSA levels achieves similar risks for prostate cancer death (2.27%) and overdiagnosis (2.4%), but reduces total tests by 59% and false-positive results by 50%.

Results of sensitivity analysis: Varying incidence inputs or reducing the survival improvement due to screening did not change conclusions.

Limitation: The model is a simplification of the natural history of prostate cancer, and improvement in survival due to screening is uncertain.

Conclusion: Compared with standard screening, PSA screening strategies that use higher thresholds for biopsy referral for older men and that screen men with low PSA levels less frequently can reduce harms while preserving lives.

Primary funding source: National Cancer Institute and Centers for Disease Control and Prevention.


Figures

Figure 1
Figure 1. Fred Hutchinson Cancer Research Center prostate cancer incidence model
(A) Underlying PSA growth before and after onset of Gleason 2–7 and 8–10 tumors. Thin gray lines are PSA trajectories by age for the two Gleason categories. Shaded bands around those lines illustrate between-individual variability in PSA values based on interquartile ranges. The dark jagged line illustrates an example PSA trajectory for a man who develops a Gleason 2–7 tumor. In this example, PSA exceeds the threshold for biopsy referral on the fifth test of a schematic screening strategy. (B) The model’s healthy, preclinical, clinical, prostate cancer mortality, and other-cause mortality states in the absence of screening. PSA = prostate-specific antigen
Figure 2
Figure 2. Tradeoff between lifetime probabilities of life saved by screening and overdiagnosis for selected screening strategies
This figure illustrates the tradeoffs for selected PSA screening strategies under a range of assumed impacts of screening on prostate cancer survival. Each point represents the tradeoff for 10 of the 35 screening strategies examined in this study: the reference strategy (Strategy 8), strategies that differ from the reference by a single screening parameter (Strategies 3, 5, 6, 9, 18, 20, and 26—see Appendix Figure 3), and strategies based on recommendations by the National Comprehensive Cancer Network (Strategy 1), the American Cancer Society (Strategy 9), and by Vickers and Lilja (Strategy 22) (8); see Table 1 for strategy details. The assumed impacts of screening on prostate cancer survival correspond to mortality reductions of 29% (the reduction observed in the ERSPC trial after correction for non-compliance), 20%, 10%, and 0% projected in a simulated version of the ERSPC after 11 years of follow-up. Probability of life saved by screening corresponding to a mortality reduction of 29% is based on the assumption that a patient whose stage was shifted from distant to local-regional stage by screening receives the survival of the earlier stage. Probability of life saved by screening corresponding to mortality reductions of 20%, 10%, and 0% in the simulated version of the ERSPC are based on a generalization of this stage-shift assumption which projects prostate cancer survival on a continuum between no impact for cases with short lead times and the full stage shift for cases with long lead times. Probability of overdiagnosis is based on model-projected competing risks of prostate cancer detection and other-cause mortality. Shaded gray lines connect projections under the same mortality reduction. The additional number needed to detect (NND) to prevent one prostate cancer death is an established summary measure of the harm-benefit tradeoff in prostate cancer screening compared to no screening, defined as the overdiagnoses divided by lives saved by screening. The NND corresponding to any point in the figure is obtained as the ratio of the probability of overdiagnosis (X value) to the probability of life saved (Y value). For reference, dashed lines radiating from the origin (representing no screening) illustrate fixed NND values of 5, 10, and 20. For a given probability of overdiagnosis, as the probability of life saved by screening decreases, the corresponding NND increases. For the mortality reduction of 29%, NNDs range from 7.1 (Strategy 1) to 3.6 (Strategy 26), and for the mortality reduction of 10%, NNDs range from 16.5 (Strategy 1) to 9.9 (Strategy 26). A strategy that falls between two NND lines (e.g., NND=5 and NND=10) has an NND between those NND values. Different strategies will be preferred depending on relative weighting of the probabilities of life saved and overdiagnosis. Among the strategies considered, Strategy 1 maximizes the probability of life saved and will be the preferred strategy if survival is the highest priority. Strategy 26 minimizes the probability of overdiagnosis and will be preferred if the morbidity associated with treatment is the greatest concern. For priorities between these extremes, the preferred strategy will be based on the most favorable balance between probabilities of life saved and overdiagnosis. For example, assuming the mortality reduction of 29%, a target tradeoff of 5 or fewer overdiagnoses per life saved (i.e., NND≤5) would identify strategies above and to the left of the NND=5 line. Assuming a mortality reduction of 20%, a target tradeoff of 5 or fewer overdiagnoses per life saved identifies Strategy 20 as the only option. If the target tradeoff is NND≤3, none of the strategies considered will satisfy this constraint. Assuming a mortality reduction of 10%, no strategies satisfy the constraint that NND≤10. ERSPC = European Randomized Study of Screening for Prostate Cancer

Comment in

Summary for patients in

References

    1. Andriole GL, Crawford ED, Grubb RL, 3rd, Buys SS, Chia D, Church TR, et al. Mortality results from a randomized prostate-cancer screening trial. N Engl J Med. 2009;360(13):1310–9. - PMC - PubMed
    1. Schröder FH, Hugosson J, Roobol MJ, Tammela TL, Ciatto S, Nelen V, et al. Screening and prostate-cancer mortality in a randomized European study. N Engl J Med. 2009;360(13):1320–8. - PubMed
    1. Andriole GL, Crawford ED, Grubb RL, 3rd, Buys SS, Chia D, Church TR, et al. Prostate Cancer Screening in the Randomized Prostate, Lung, Colorectal, and Ovarian Cancer Screening Trial: Mortality Results after 13 Years of Follow-up. J Natl Cancer Inst. 2012;104:1–8. - PMC - PubMed
    1. Schroder FH, Hugosson J, Roobol MJ, Tammela TLJ, Ciatto S, Nelen V, et al. Prostate-cancer mortality at 11 years of follow-up. The New England journal of medicine. 2012;366(11):981–90. - PMC - PubMed
    1. Gulati R, Tsodikov A, Wever EM, Mariotto AB, Heijnsdijk EA, Katcher J, et al. The impact of PLCO control arm contamination on perceived PSA screening efficacy. Cancer Causes and Control. 2012;23(6):827–35. - PMC - PubMed

Publication types

MeSH terms

Substances