. 2013 Mar 15;112(6):911-23.
doi: 10.1161/CIRCRESAHA.111.300179. Epub 2013 Feb 4.

De-SUMOylation enzyme of sentrin/SUMO-specific protease 2 regulates disturbed flow-induced SUMOylation of ERK5 and p53 that leads to endothelial dysfunction and atherosclerosis

Affiliations

De-SUMOylation enzyme of sentrin/SUMO-specific protease 2 regulates disturbed flow-induced SUMOylation of ERK5 and p53 that leads to endothelial dysfunction and atherosclerosis

Kyung-Sun Heo et al. Circ Res. .

Abstract

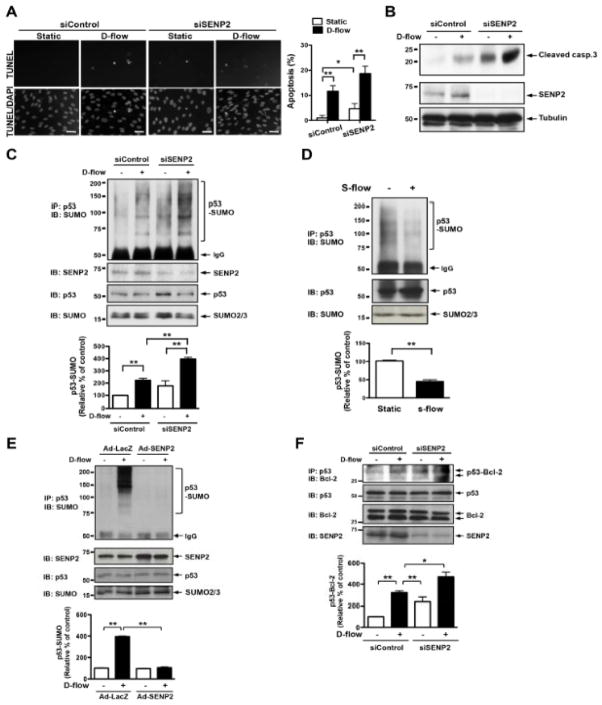
Rationale: Disturbed flow induces proinflammatory and apoptotic responses in endothelial cells, causing them to become dysfunctional and subsequently proatherogenic.

Objective: Although a possible link between SUMOylation of p53 and ERK5 detected during endothelial apoptosis and inflammation has been suggested, the mechanistic insights, especially under the proatherogenic flow condition, remain largely unknown.

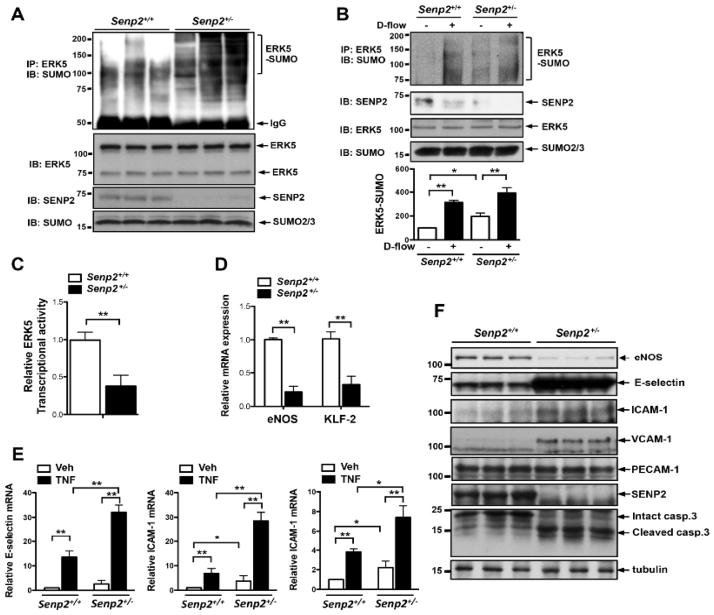
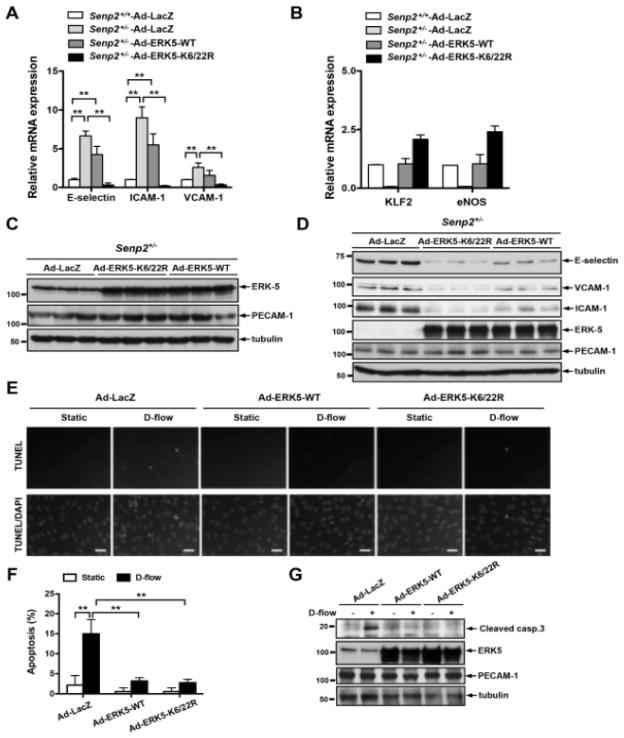
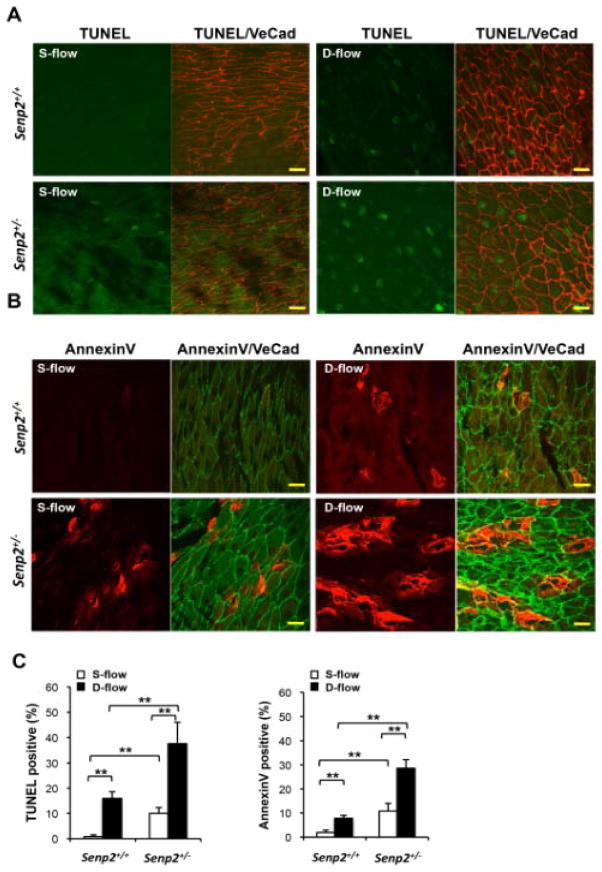
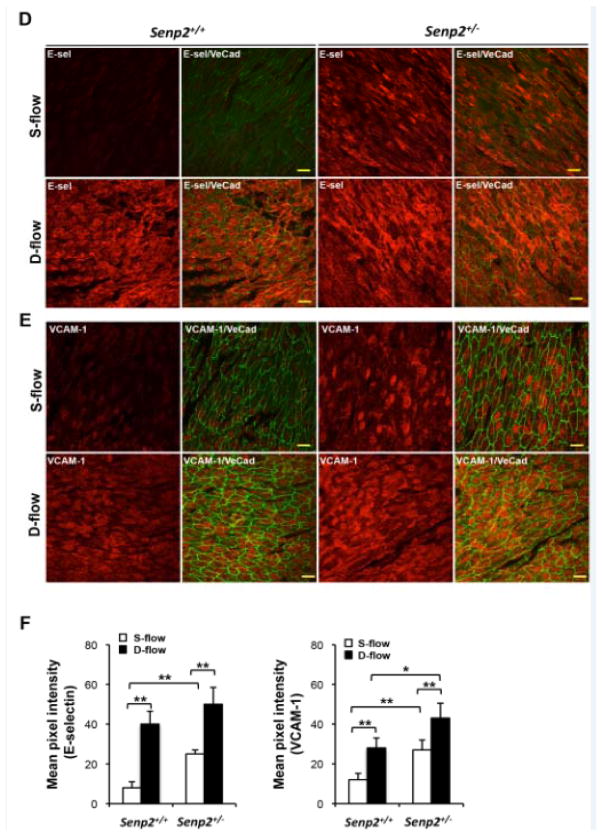
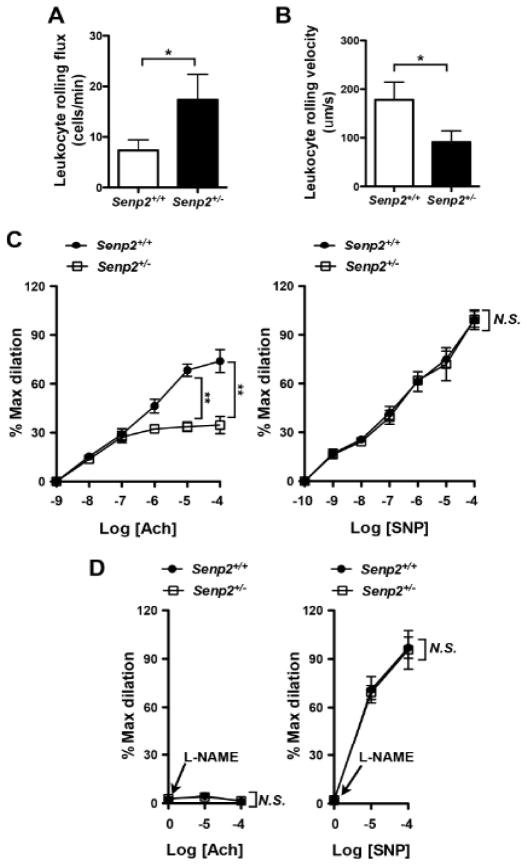
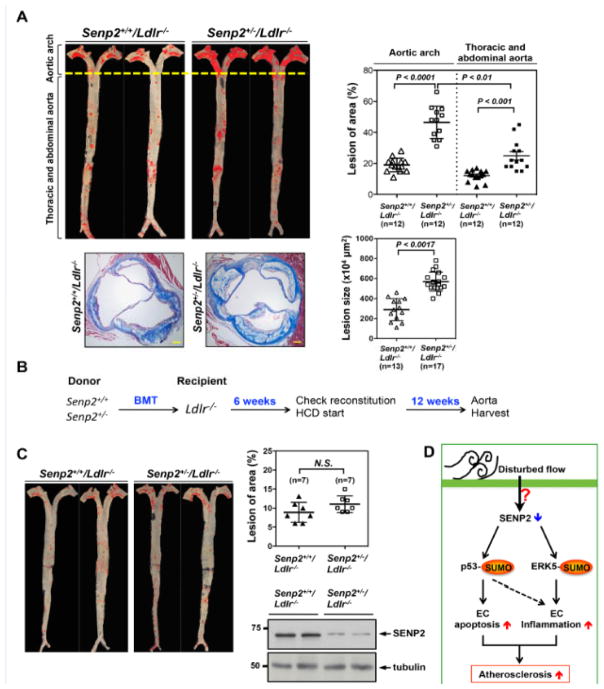
Methods and results: SUMOylation of p53 and ERK5 was induced by disturbed flow but not by steady laminar flow. To examine the role of the disturbed flow-induced p53 and ERK5 SUMOylation, we used de-SUMOylation enzyme of sentrin/Small Ubiquitin-like MOdifier (SUMO)-specific protease 2 deficiency (Senp2(+/-)) mice and observed a significant increase in endothelial apoptosis and adhesion molecule expression both in vitro and in vivo. These increases, however, were significantly inhibited in endothelial cells overexpressing p53 and ERK5 SUMOylation site mutants. Senp2(+/-) mice exhibited increased leukocyte rolling along the endothelium, and accelerated formation of atherosclerotic lesions was observed in Senp2(+/-)/Ldlr(-/-), but not in Senp2(+/+)/Ldlr(-/-), mice fed a high-cholesterol diet. Notably, the extent of lesion size in the aortic arch of Senp2(+/-)/Ldlr(-/-) mice was much larger than that in the descending aorta, also suggesting a crucial role of the disturbed flow-induced SUMOylation of proteins, including p53 and ERK5 in atherosclerosis formation.

Conclusions: These data show the unique role of sentrin/SUMO-specific protease 2 on endothelial function under disturbed flow and suggest that SUMOylation of p53 and ERK5 by disturbed flow contributes to the atherosclerotic plaque formation. Molecules involved in this newly discovered signaling will be useful targets for controlling endothelial cells dysfunction and consequently atherosclerosis formation.


Figures

Figure 1
Figure 1. SENP2 inhibits endothelial apoptosis by regulating p53 SUMOylation
(A–B) HAECs were transfected with control or SENP2 siRNAs for 48 hrs and then stimulated by disturbed flow (d-flow) or no flow for 36 hrs. TUNEL staining (A) or Western blotting with anti-cleaved caspase3 antibody (B) was performed to determine apoptosis. (A) Images were recorded as described in Materials and Methods after counterstaining with DAPI to visualize nuclei (bottom). Apoptotic nuclei appear white and light-grey (top). Bars, 20μm. Quantification of apoptosis is shown as the percentage of TUNEL-positive cells (A, right panel). Shown is mean ± S.D., (n =3). **P<0.01, *P<0.05. (B) Cleaved-caspase3 (casp.3) expression was increased by transfection with SENP2 siRNA. SENP2 expression and protein loading were assessed by Western blotting with anti-SENP2 (middle) and anti-tubulin (bottom), respectively. Representative blots from duplicate experiments are shown. (C and E) HAECs (C) or HUVECs (E) were transfected with control or SENP2 siRNA for 48 hrs (C) or transduced with 50 MOI of Ad-LacZ or Ad-SENP2 for 16 hrs (E) and then stimulated by d-flow or no flow for 3 hrs. p53 SUMOylation was detected by immunoprecipitation with rabbit anti-p53 followed by Western blotting with mouse anti-SUMO2/3 (top). Expression of SENP2, p53, and SUMO is shown using antibodies against each of the respective proteins. p53 SUMOylation was quantified as described in Materials and Methods (bottom panel). Shown is mean ± S.D., (n =3), **P<0.01. (D) HUVECs were stimulated by steady laminar flow (s-flow) or no flow for 3 hrs. p53 SUMOylation was detected by immunoprecipitation with rabbit anti-p53 followed by Western blotting with mouse anti-SUMO2/3 (top). Expression of p53 and SUMO are shown using antibodies against each of the respective proteins. p53 SUMOylation was quantified as described in Materials and Methods (bottom panel). Shown is mean ± S.D., (n =3), **P<0.01. (F) HUVECs were transfected with control or SENP2 siRNA for 48 hrs and stimulated by d-flow or no flow for 3 hrs. p53-Bcl-2 binding was detected by immunoprecipitation with rabbit anti-Bcl-2 followed by Western blotting with mouse anti-p53 (top). Expression of SENP2, p53, and Bcl-2 is shown using antibodies against each of the respective proteins. p53 and Bcl-2 binding was quantified as described in Materials and Methods (bottom panel). Shown is mean ± S.D., (n =3), **P<0.01. D-flow, disturbed flow; Static, no flow; and S-flow, steady laminar flow.
Figure 2
Figure 2. Reduced SENP2 expression increases p53 SUMOylation and apoptosis in mouse lung and aortic ECs
(A–B) p53 SUMOylation was studied with or without d-flow for 3 hrs in three different preparations of MLECs (A) or MAECs (B) isolated from Senp2+/+ or Senp2+/− mice using immunoprecipitation with rabbit anti-p53 followed by Western blotting with mouse anti-SUMO2/3 (top). Antibodies specific to SENP2, p53, or SUMO2/3 were used to detect the expression level of each protein. p53 SUMOylation was quantified as described in Materials and Methods (bottom panel). Shown is mean± S.D., (n =3), **P<0.01. (C) MLECs isolated from Senp2+/+ or Senp2+/− mice were transduced with indicated adenovirus (Ad) for 16 hrs and then analyzed for apoptosis by TUNEL staining. Cells were counterstained with DAPI (bottom). Apoptotic nuclei appear white and light-grey (top). Bars, 25μm. Quantification of apoptosis is shown as the percentage of TUNEL positive cells (C, right upper panel). *P<0.05, **P<0.01. Expression levels of exogenous p53 and p53K386R were examined by Western blotting with anti-p53 (C, right lower panel).
Figure 3
Figure 3. SENP2 inhibits disturbed flow-induced endothelial ERK5 SUMOylation
(A and B) HUVECs were stimulated by d-flow (A) or s-flow (B) for 3 hrs and their lysates were analyzed by immunoprecipitation with rabbit anti-ERK5 or IgG as a control. ERK5 SUMOylation was detected by Western blotting with mouse anti-SUMO2/3 (top). Expressions of ERK5 and SUMO were detected by using specific antibodies as indicated. p53 SUMOylation was quantified as described in Materials and Methods (bottom panel). Shown is mean ± S.D., (n =3). *P<0.05, **P<0.01. (C and D) HAECs (C) or HUVECs (D) were transfected with indicated siRNA for 48 hrs (C) or adenovirus for 16 hrs (D), and then stimulated by d-flow or no flow for 3 hrs. ERK5 SUMOylation was assessed as described in Fig. 3A. (E) HUVECs were transfected with SENP2 siRNA or control siRNA, or Ad-SENP2 or Ad-LacZ for 24 hrs and then transfected with Gal4-ERK5 and Gal4-responsive luciferase reporter pG5-Luc. After 18 hrs, cells were stimulated by d-flow or no flow for 6 hrs and then ERK5 transcriptional activity was assayed by a dual-luciferase reporter assay. Results were expressed as relative fold-changes vs. static cells in the siControl or LacZ control. Shown is mean ± S.D., (n =3). *P<0.05, **P<0.01. (F, G, H and I) HUVECs were transfected with SENP2 or control siRNA for 48 hrs or Ad-LacZ or Ad-SENP2 for 18 hrs followed by stimulation with d-flow or no flow for 24 hrs. Messenger RNA levels of E-selectin, ICAM-1, and VCAM-1 as inflammatory factors (F and G) and eNOS and KLF-2 as anti-inflammatory factors (H and I) were detected by qRT-PCR as described in methods. Results were expressed as relative fold-changes vs. static cells in the siControl or LacZ control. Shown is the mean ± S.D., (n =3). *P<0.05, **P<0.01.
Figure 4
Figure 4. Disturbed flow inhibits ERK5 transcriptional activity and the expression of eNOS and KLF2 and increases adhesion molecule expression via SENP2
(A) ERK5 SUMOylation was studied in MLECs isolated from three different Senp2+/+ or Senp2+/− mice using immunoprecipitation with rabbit anti-ERK5 followed by Western blotting with mouse anti-SUMO2/3 (top). SENP2, p53, or SUMO expression was detected by specific antibodies as indicated. (B) ERK5 SUMOylation was observed in MAECs isolated from Senp2+/+ or Senp2+/− mice with or without d-flow for 3 hrs using immunoprecipitation with rabbit anti-p53 followed by Western blotting with mouse anti-SUMO2/3 (top). Antibodies specific to SENP2, p53, or SUMO2/3 were used to detect the expression level of each protein. p53 SUMOylation was quantified as described in Materials and Methods (bottom panel). Shown is mean± S.D., (n =3). *P<0.05, **P<0.01. (C) ERK5 transcriptional activity was examined as described in Fig. 3E in MLECs from Senp2+/+ and Senp2+/− mice. Shown is the mean ± S.D., (n =3). **P<0.01. (D) mRNA levels of eNOS and KLF-2 were determined by qRT-PCR as described in methods. Shown is the mean ± S.D., (n =3). **P<0.01. (E) mRNA levels of adhesion molecules in Senp2+/+ or Senp2+/− MLECs treated with vehicle or TNFα for 6 hrs were assessed by qRT-PCR as described in the methods. Results were expressed as relative fold-increases vs. vehicle treated Senp2+/+ cells. Shown is the mean ± S.D., (n =3). *P<0.05, **P<0.01. (F) Expressions of eNOS, adhesion molecules as well as cleaved-caspase3 in MLECs isolated from three different Senp2+/+ or Senp2+/− mice were determined by Western blotting. PECAM-1 expression was used to show the identity of cells as ECs. Veh, vehicle; and casp.3, caspase3.
Figure 5
Figure 5. The crucial role of ERK5 SUMOylation in inflammation and apoptosis in MLECs and MAECs
(A, B) MLECs isolated from three different Senp2+/− mice were transduced with indicated Ad for 18 hrs and mRNA levels were determined by qRT-PCR using indicated specific primers as described in Fig. 3H. Shown is the mean ± S.D., (n =3). *P<0.05, **P<0.01. (C) ERK5-WT and ERK5-K6/22R expression were confirmed by Western blotting. (D) MLECs isolated from three different Senp2+/− mice were transduced with indicated Ad for 18 hrs and expressions of adhesion molecules were determined by Western blotting with indicated antibodies. (E-G) MAECs from Senp2+/+ mice were transduced with indicated Ad for 18 hrs and stimulated by d-flow for 36 hrs. TUNEL staining (E) or Western blotting with anti-cleaved-caspase3 (G) was performed. (E) Apoptotic and non-apoptotic nuclei appear white and light-grey (top) and grey (bottom), respectively. Bars, 20μm. (F) Quantification of apoptosis is shown as the percentage of TUNEL-positive cells. Shown is the mean ± S.D., (n =3). **P<0.01. (G) D-flow-induced cleaved-caspase3 expression was inhibited by Ad-ERK5-WT and Ad-ERK5-K6/22K transduction. ERK5 expression and protein loading were assessed by Western blotting with indicated antibodies. D-flow, disturbed flow; Static, no flow; and casp.3, caspase3.
Figure 6
Figure 6. En face immunohistochemistry for EC apoptosis, E-selectin, and VCAM-1 in Senp2+/+ and Senp2+/− mouse aorta
(A and B) EC apoptosis in the aortic arch of 7-week-old Senp2+/+ or Senp2+/− mice. TUNEL- (green, A) or annexinV- (red, B) positive cells in both lesser (d-flow) and greater (s-flow) curvature areas were increased in the Senp2+/− compared with Senp2+/+ mouse aorta. Anti-VE-cad staining was used as a EC marker. Bars, 20 μm. (C) Quantification of apoptotic cells examined by the TUNEL (left) or annexinV (right) assay (n=3 each). Data are shown as the mean ± S.D., **P<0.01. En face preparations were double-stained with anti-VE-cad and anti-E-selectin (D) or anti-VCAM-1 (E). A series of confocal optical section images were collected at a 0.5μm increment and a Z-stack image of about 4μm thickness from the luminal surface was obtained. From each image the background fluorescence intensity was subtracted and the pixel number of the stained region, per unit area, of the endothelium in d- and s-flow areas within the aortic arch from Senp2+/+ or Senp2+/− mice were determined (n=3 each). Bars, 20μm. (F) Bar graphs show quantification of E-selectin (left) and VCAM-1 (right) in d- and s-flow areas of the aortic arch from Senp2+/+ or Senp2+/− mice. Data are shown as the mean ± S.D., *P<0.05, **P<0.01.
Figure 7
Figure 7. Increased leukocyte rolling and reduced endothelium-dependent vasodilatation in Senp2+/− mice
Leukocyte rolling in vivo. Quantified data on leukocyte rolling flux (A) and leukocyte rolling velocity (B) are shown. To analyze these parameters, image analysis software (NIS elements, Nikon) was used (n = 4, mean ± S.D.; **, P < 0.01). (C) Endothelium-dependent vessel relaxation by ACh (left) was inhibited, while SNP (right)-induced relaxation did not show any differences between Senp2+/− and Senp2+/+ arterioles. At least, two arterioles per animals were examined. Data are shown as the mean ± S.D., n = 4 mice, **P < 0.01. (D) Effect of L-NAME on the ACh (left)- or SNP (right)-induced vessel dilation in arterioles of Senp2+/+ and Senp2+/− mice. Data are shown as the mean ± S.D., n = 4 mice, **P < 0.01. Not significant, N.S.
Figure 8
Figure 8. Reduced SENP2 expression accelerates atherosclerotic plaque formation, which is mediated by vascular but not by hematopoietic cells
Senp2+/+/Ldlr−/− and Senp2+/−/Ldlr−/− mice were given a high cholesterol diet for 16-week. Senp2+/−/Ldlr−/− mice exhibited increased Oil red O-stained atherosclerotic lesions in the whole aorta, (top, left) as well as, increased Masson’s trichrome stained atherosclerotic lesions in the cross-section of aortic valve region (bottom, left two). Bars, 50 μm. The graphs on the right show quantification of these data. Mean ± S.D. (n=12, whole aorta of Senp2+/+/Ldlr−/− and Senp2+/−/Ldlr−/−; n=13, Senp2+/+/Ldlr−/−; and n=17, Senp2+/−/Ldlr−/−). The lesions of aortic arch compared to the lesion of descending aorta in the Senp2+/−/Ldlr−/− mice are shown. **P<0.01. (B) The scheme of bone marrow transplantation. The transplantation of bone marrow cells from Senp2+/+ or Senp2+/− mice into Ldlr−/− mice was performed and 6-week later, mice were given a high cholesterol diet for 12-week. (C) Atherosclerotic lesions were identified by Oil red O staining of the whole aorta (C, left). The graphs show quantified data (C, right upper). Mean ± S.D. (n=7). Not significant, N.S. The successful chimerism of BM cells was confirmed by Western blotting with anti-SENP2 using the blood cells after 6-weeks transplantation (C, right lower). (D) Schematic diagram showing the p53 and ERK5 SUMOylation signaling pathway mediating the EC apoptosis and inflammation to cause the atherosclerosis formation in response to disturbed flow.

Similar articles

Cited by

References

    1. Libby P, Ridker PM, Maseri A. Inflammation and atherosclerosis. Circulation. 2002;105:1135–1143. - PubMed
    1. Lusis AJ. Atherosclerosis. Nature. 2000;407:233–241. - PMC - PubMed
    1. Berk BC. Atheroprotective signaling mechanisms activated by steady laminar flow in endothelial cells. Circulation. 2008;117:1082–1089. - PubMed
    1. Malek AM, Alper SL, Izumo S. Hemodynamic shear stress and its role in atherosclerosis. JAMA : the journal of the American Medical Association. 1999;282:2035–2042. - PubMed
    1. Heo KS, Lee H, Nigro P, Thomas T, Le NT, Chang E, McClain C, Reinhart-King CA, King MR, Berk BC, Fujiwara K, Woo CH, Abe J. Pkczeta mediates disturbed flow-induced endothelial apoptosis via p53 sumoylation. J Cell Biol. 2011;193:867–884. - PMC - PubMed

Publication types

MeSH terms

Substances