. 2013 Feb 19;110(8):2946-51.
doi: 10.1073/pnas.1222738110. Epub 2013 Feb 4.

Conservation and divergence in the transcriptional programs of the human and mouse immune systems

Affiliations

Conservation and divergence in the transcriptional programs of the human and mouse immune systems

Tal Shay et al. Proc Natl Acad Sci U S A. .

Abstract

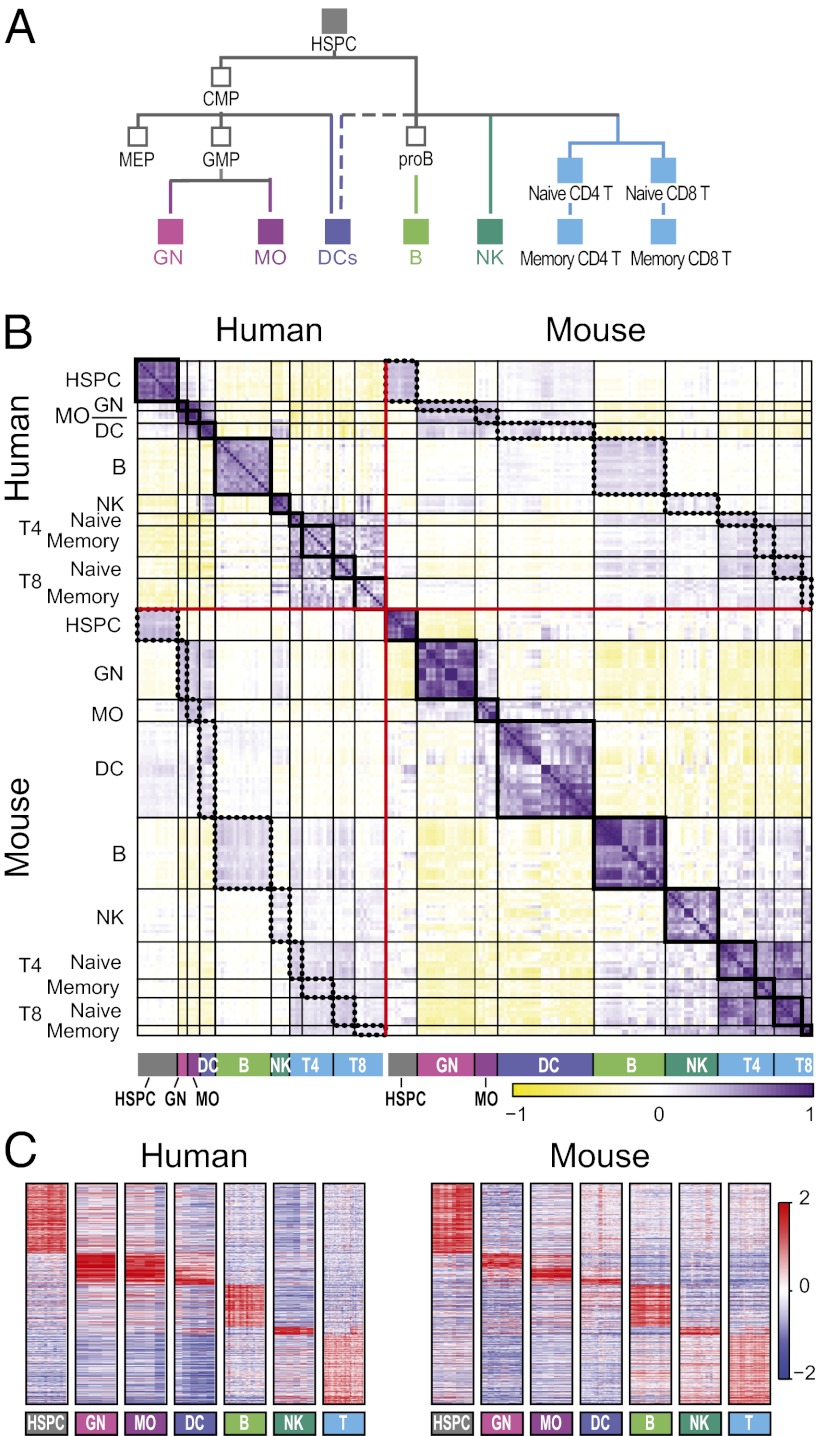
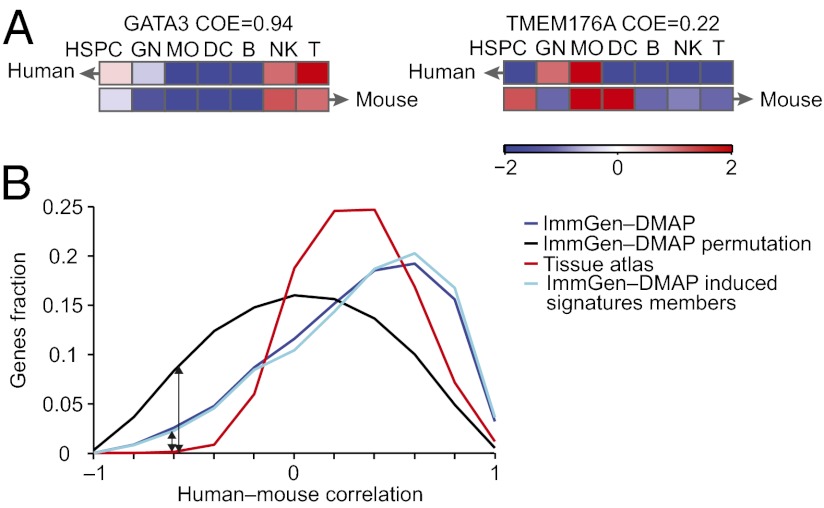
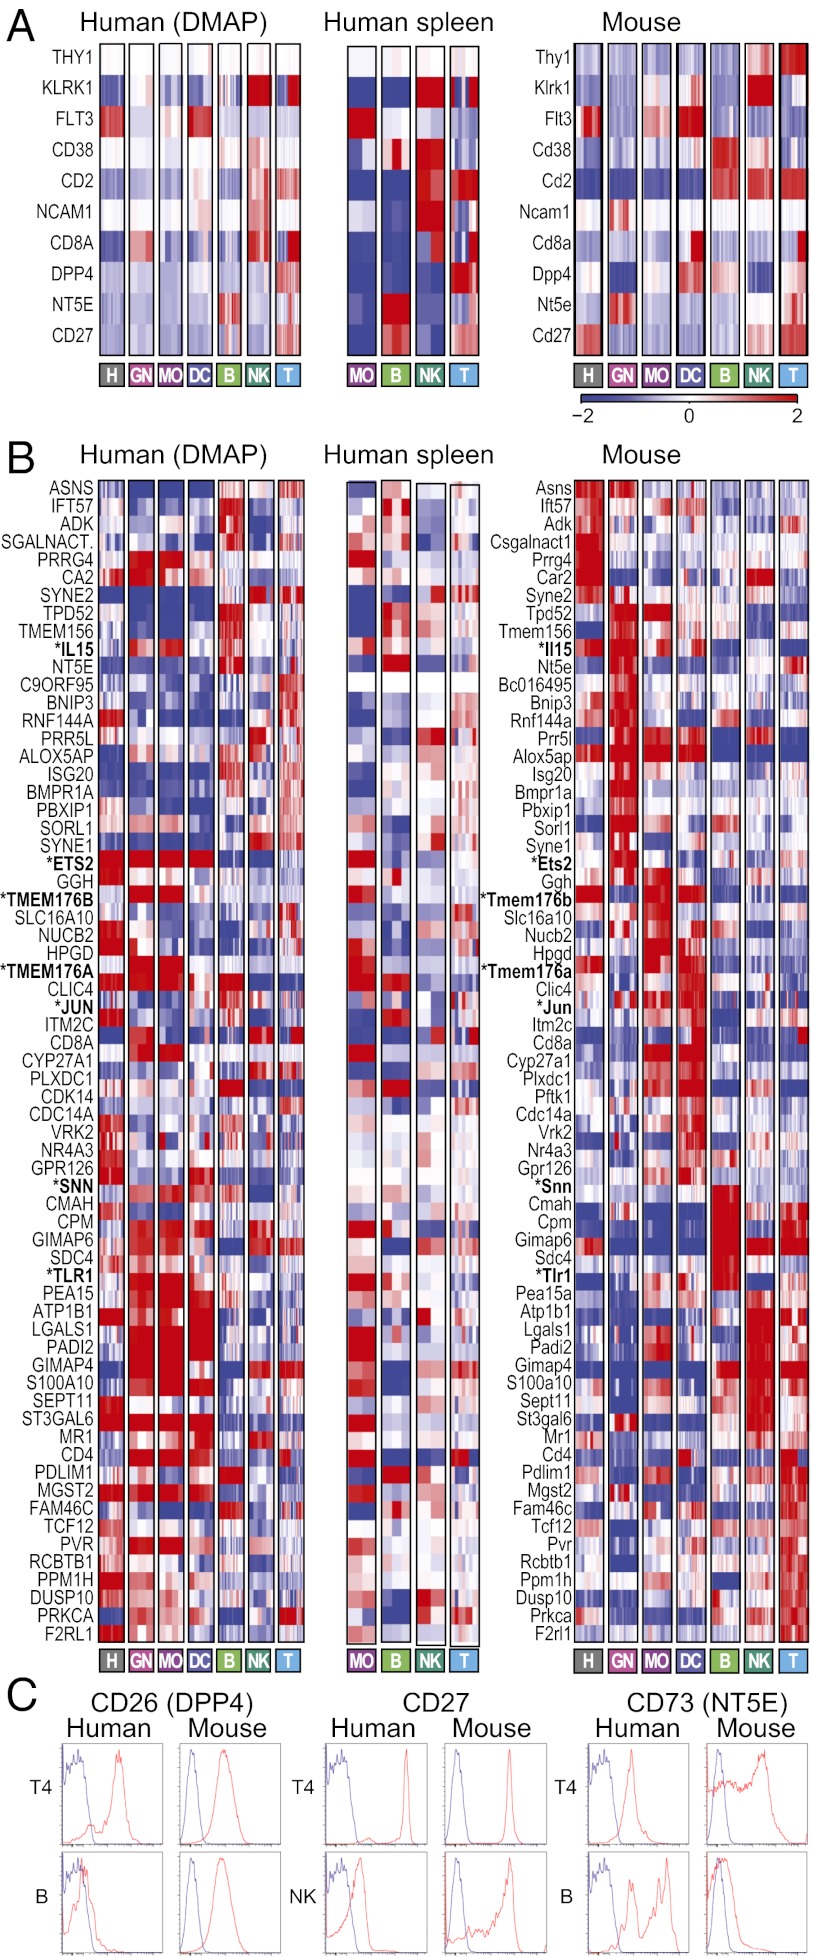
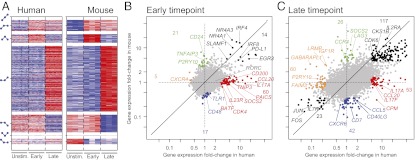
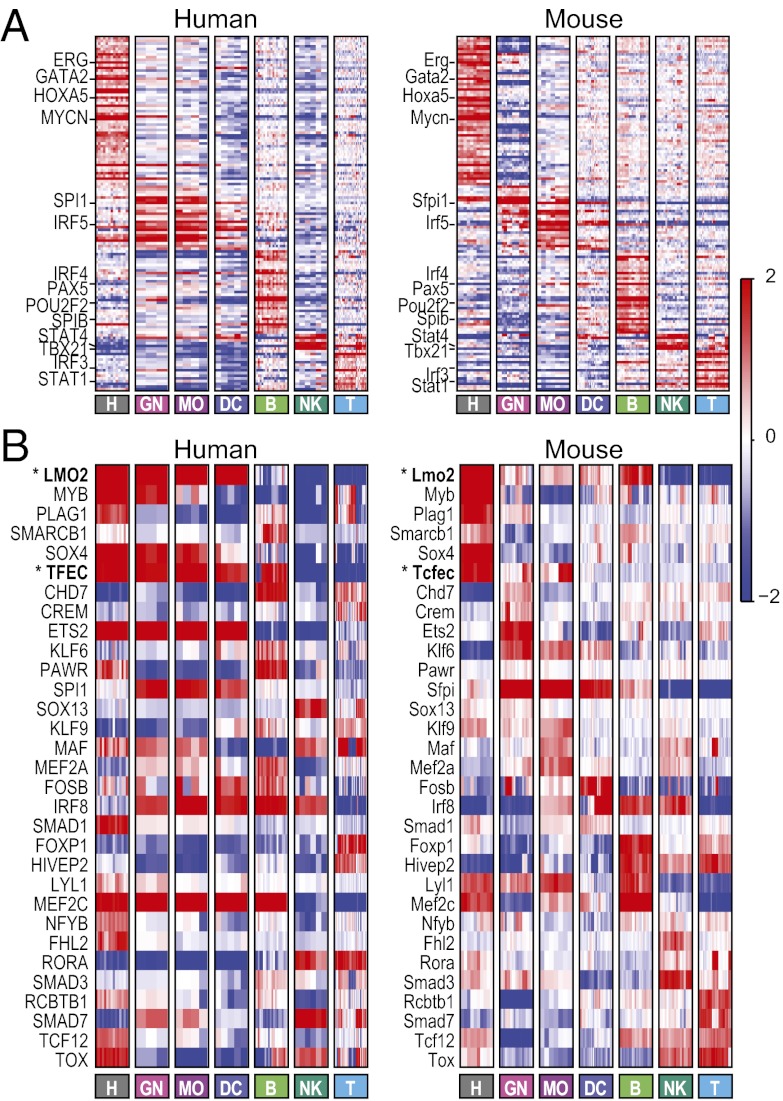
Much of the knowledge about cell differentiation and function in the immune system has come from studies in mice, but the relevance to human immunology, diseases, and therapy has been challenged, perhaps more from anecdotal than comprehensive evidence. To this end, we compare two large compendia of transcriptional profiles of human and mouse immune cell types. Global transcription profiles are conserved between corresponding cell lineages. The expression patterns of most orthologous genes are conserved, particularly for lineage-specific genes. However, several hundred genes show clearly divergent expression across the examined cell lineages, and among them, 169 genes did so even with highly stringent criteria. Finally, regulatory mechanisms--reflected by regulators' differential expression or enriched cis-elements--are conserved between the species but to a lower degree, suggesting that distinct regulation may underlie some of the conserved transcriptional responses.


Conflict of interest statement

The authors declare no conflict of interest.

Figures

Fig. 1.
Fig. 1.
Conserved transcriptional profiles in matched immune lineages between human and mouse. (A) Simplified lineage tree for the immune system cell populations measured in both human and mouse compendia. CMP, common myeloid progenitor; GMP, granulocyte–monocyte progenitor; MEP, megakaryocyte–erythroid progenitor. Filled rectangles, cell types included in the common lineages. Colors mark those lineages in all figures. (B) Global correlation matrix of the Pearson coefficients (yellow/purple color scale on the bottom) between every pair of human and mouse samples in the common lineages. Samples are in rows and columns sorted by the lineage tree. Red lines separate species, black lines separate lineages, thick black rectangles mark correlations within each lineage within a species, and dotted rectangles mark correlations between samples of the same lineage between species. (C) Mean-centered expression values (red/blue color scale on the right) of the genes shared between matching lineage signatures in human (Left) and mouse (Right). Signatures were defined in each species separately as composed of genes that are expressed in a lineage-specific pattern in that species. Every pair of matching signatures was compared between the species to identify all those pairs of orthologs that were members of both signatures. Genes are sorted by human lineage with maximal expression level.
Fig. 2.
Fig. 2.
COE between human–mouse orthologs. (A) COE is calculated for a pair of human–mouse orthologs as the Pearson correlation coefficient between their median expression profiles (color scale on the bottom) in each lineage. Shown are examples for (Left) highly conserved orthologs and (Right) lowly conserved orthologs. (B) Significantly high COE values in human and mouse. Shown is a distribution of human and mouse COE values (blue), only lineage signature genes (light blue), a tissue atlas (8) (red), and a null distribution created by random pairings of one-to-one orthologs (black).
Fig. 3.
Fig. 3.
Differentially expressed genes between human and mouse. (A) Expression profiles (color scale on the bottom) in (Left) the human blood cell compendium, (Center) human splenocytes, and (Right) mouse of genes that were previously reported to be differentially expressed between human and mouse and are consistently different in our datasets or different in our datasets and validated below. (B) Selected genes with different expression patterns between human (Left) blood, (Center) spleen, and (Right) mouse immune cell types that were not previously reported. Shown are mean-centered expression values of genes sorted by mouse lineage with maximal expression level. Genes discussed in the text are marked with bold and asterisks. (C) Flow cytometry analysis of predicted human/mouse differences. Several cell surface markers were chosen (based on reagent availability) among differentially expressed genes and analyzed by staining of human peripheral blood mononuclear cells (PBMCs) or B6 splenocytes. Profiles in Upper and Lower depict cell populations for which expression was predicted to be shared or divergent in both species, respectively.
Fig. 4.
Fig. 4.
Transcriptional conservation in human- and mouse-activated CD4+ T cells. (A) Conservation of activation patterns. (Right) The significantly differentially expressed mouse genes were sorted by their expression patterns (schematically showing change over time on the left of the heat maps) and (Left) the expression of their orthologous genes in human-activated T cells. (B and C) Comparison of differential expression. Shown are scatter plots comparing the change in expression in (B) early and (C) later time points relative to prestimulation in human (x axis) and mouse (y axis) CD4+ T cells. The global off-diagonal skew reflects the slightly weaker activation of mouse CD4+ T cells under these conditions. The black points denote transcripts that are induced in both species or repressed in both species. The colored points denote transcripts that are affected in only one species (red, unchanged in mouse and induced in human; orange, unchanged in mouse and repressed in human; green, induced in mouse and unchanged in human; blue, repressed in mouse and unchanged in human) (Dataset S3).
Fig. 5.
Fig. 5.
Regulation of human and mouse immune system differentiation is largely conserved. (A) Conserved lineage-specific expression of regulators. Shown are mean-centered expression values (red/blue color bar on the right) of regulators with maximal expression in the same lineage in (Left) human and (Right) mouse. Genes are sorted by mouse lineage with maximal expression. Selected gene names are highlighted on the left. (B) Divergent expression of regulators. Shown are mean-centered expression values of selected regulators with coherent expression patterns within each species that differ between the two species (Left, human; Right, mouse). Genes are sorted by mouse lineage with maximal expression. Genes mentioned in the text are marked with bold and asterisks.

References

    1. Payne KJ, Crooks GM. Immune-cell lineage commitment: Translation from mice to humans. Immunity. 2007;26(6):674–677. - PubMed
    1. Davis MM. A prescription for human immunology. Immunity. 2008;29(6):835–838. - PMC - PubMed
    1. Dermitzakis ET, Clark AG. Evolution of transcription factor binding sites in Mammalian gene regulatory regions: Conservation and turnover. Mol Biol Evol. 2002;19(7):1114–1121. - PubMed
    1. Odom DT, et al. Tissue-specific transcriptional regulation has diverged significantly between human and mouse. Nat Genet. 2007;39(6):730–732. - PMC - PubMed
    1. Ravasi T, et al. An atlas of combinatorial transcriptional regulation in mouse and man. Cell. 2010;140(5):744–752. - PMC - PubMed

Publication types