

Genome-wide analysis of thyroid hormone receptors shared and specific functions in neural cells
- PMID: 23382204
- PMCID: PMC3581916
- DOI: 10.1073/pnas.1210626110
Genome-wide analysis of thyroid hormone receptors shared and specific functions in neural cells
Abstract
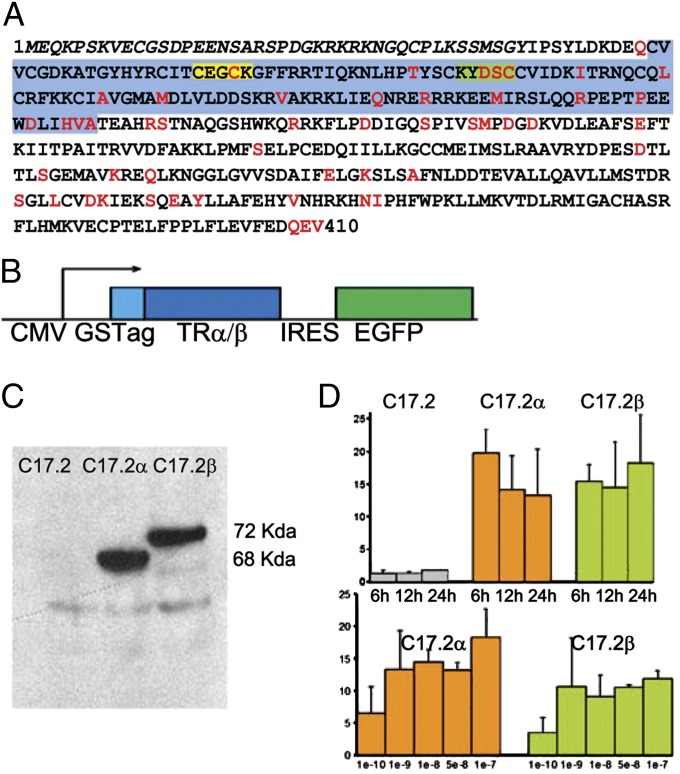
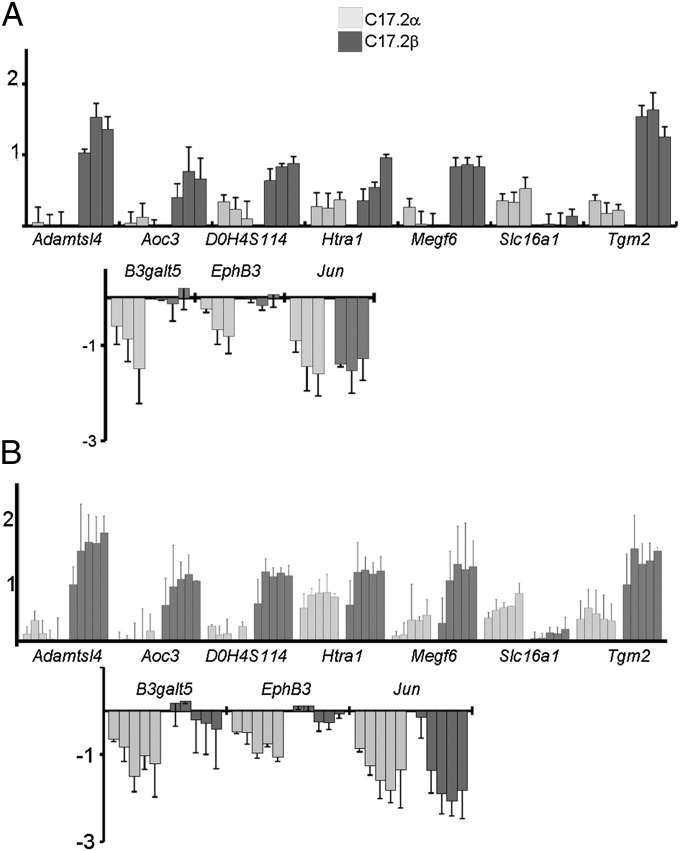
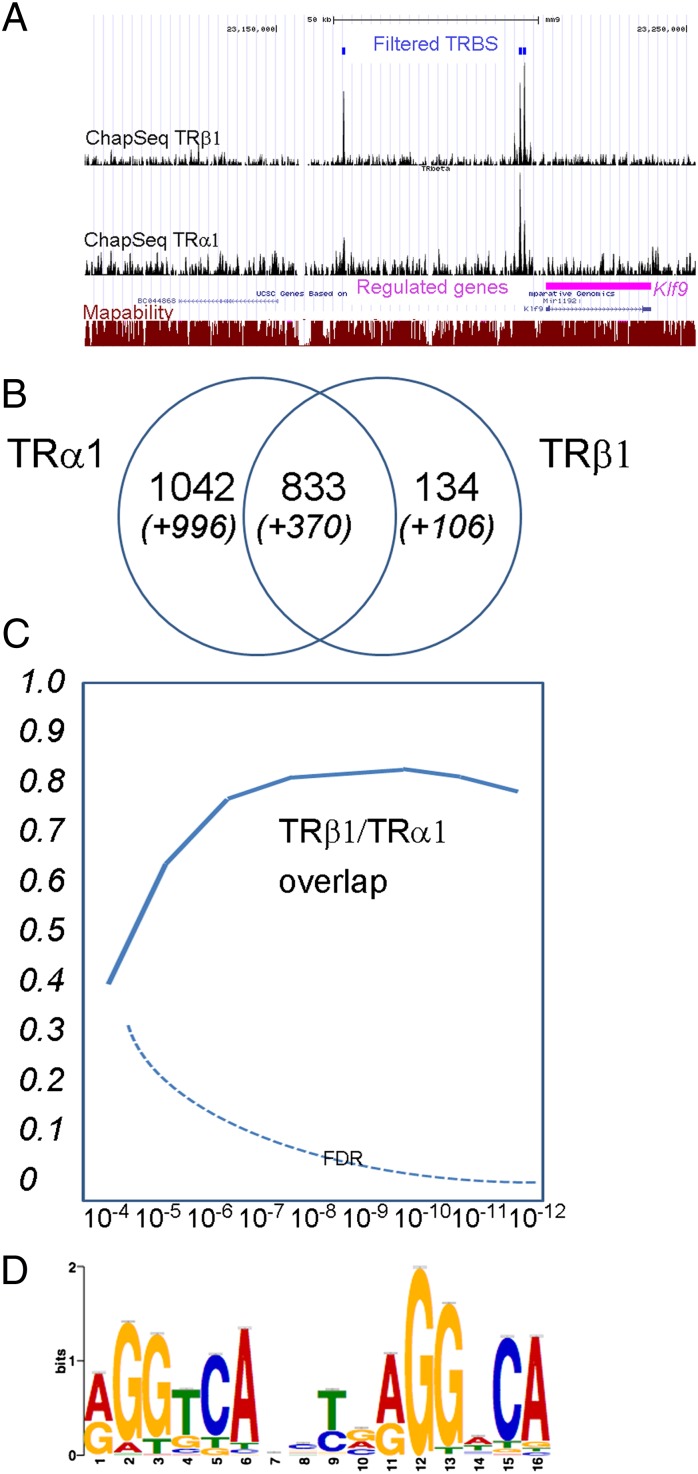
TRα1 and TRβ1, the two main thyroid hormone receptors in mammals, are transcription factors that share similar properties. However, their respective functions are very different. This functional divergence might be explained in two ways: it can reflect different expression patterns or result from different intrinsic properties of the receptors. We tested this second hypothesis by comparing the repertoires of 3,3',5-triiodo-L-thyronine (T3)-responsive genes of two neural cell lines, expressing either TRα1 or TRβ1. Using transcriptome analysis, we found that a substantial fraction of the T3 target genes display a marked preference for one of the two receptors. So when placed alone in identical situations, the two receptors have different repertoires of target genes. Chromatin occupancy analysis, performed at a genome-wide scale, revealed that TRα1 and TRβ1 cistromes were also different. However, receptor-selective regulation of T3 target genes did not result from receptor-selective chromatin occupancy of their promoter regions. We conclude that modification of TRα1 and TRβ1 intrinsic properties contributes in a large part to the divergent evolution of the receptors' function, at least during neurodevelopment.
Conflict of interest statement
The authors declare no conflict of interest.
Figures


Similar articles
-
Direct regulation of androgen receptor-associated protein 70 by thyroid hormone and its receptors.Endocrinology. 2007 Jul;148(7):3485-95. doi: 10.1210/en.2006-1239. Epub 2007 Apr 5. Endocrinology. 2007. PMID: 17412801
-
Divergent regulation of cardiac KCND3 potassium channel expression by the thyroid hormone receptors alpha1 and beta1.J Physiol. 2009 Mar 15;587(Pt 6):1319-29. doi: 10.1113/jphysiol.2008.168385. Epub 2009 Jan 26. J Physiol. 2009. PMID: 19171649 Free PMC article.
-
Transcriptional regulatory patterns of the myelin basic protein and malic enzyme genes by the thyroid hormone receptors alpha1 and beta1.J Biol Chem. 1998 Sep 11;273(37):24239-48. doi: 10.1074/jbc.273.37.24239. J Biol Chem. 1998. PMID: 9727048
-
Thyroid hormone receptors: the challenge of elucidating isotype-specific functions and cell-specific response.Biochim Biophys Acta. 2013 Jul;1830(7):3900-7. doi: 10.1016/j.bbagen.2012.06.003. Epub 2012 Jun 13. Biochim Biophys Acta. 2013. PMID: 22704954 Review.
-
Mechanisms of nongenomic actions of thyroid hormone.Front Neuroendocrinol. 2008 May;29(2):211-8. doi: 10.1016/j.yfrne.2007.09.003. Epub 2007 Oct 5. Front Neuroendocrinol. 2008. PMID: 17983645 Review.
Cited by
-
Aberrant Calreticulin Expression in Articular Cartilage of Dio2 Deficient Mice.PLoS One. 2016 May 10;11(5):e0154999. doi: 10.1371/journal.pone.0154999. eCollection 2016. PLoS One. 2016. PMID: 27163789 Free PMC article.
-
Functional Definition of Thyroid Hormone Response Elements Based on a Synthetic STARR-seq Screen.Endocrinology. 2022 Aug 1;163(8):bqac084. doi: 10.1210/endocr/bqac084. Endocrinology. 2022. PMID: 35678380 Free PMC article.
-
An evo-devo approach to thyroid hormones in cerebral and cerebellar cortical development: etiological implications for autism.Front Endocrinol (Lausanne). 2014 Sep 9;5:146. doi: 10.3389/fendo.2014.00146. eCollection 2014. Front Endocrinol (Lausanne). 2014. PMID: 25250016 Free PMC article. Review.
-
Thyroid hormone role on cerebellar development and maintenance: a perspective based on transgenic mouse models.Front Endocrinol (Lausanne). 2014 May 20;5:75. doi: 10.3389/fendo.2014.00075. eCollection 2014. Front Endocrinol (Lausanne). 2014. PMID: 24904526 Free PMC article. Review.
-
A Transgenic Mouse Model for Detection of Tissue-Specific Thyroid Hormone Action.Endocrinology. 2018 Feb 1;159(2):1159-1171. doi: 10.1210/en.2017-00582. Endocrinology. 2018. PMID: 29253128 Free PMC article.
References
-
- Laudet V. The origins and evolution of vertebrate metamorphosis. Curr Biol. 2011;21(18):R726–R737. - PubMed
-
- Flamant F, et al. International Union of Pharmacology. LIX. The pharmacology and classification of the nuclear receptor superfamily: Thyroid hormone receptors. Pharmacol Rev. 2006;58(4):705–711. - PubMed
-
- Desvergne B. How do thyroid hormone receptors bind to structurally diverse response elements? Mol Cell Endocrinol. 1994;100(1–2):125–131. - PubMed
-
- Perissi V, Rosenfeld MG. Controlling nuclear receptors: The circular logic of cofactor cycles. Nat Rev Mol Cell Biol. 2005;6(7):542–554. - PubMed
Publication types
MeSH terms
Substances
Associated data
- Actions
- Actions
- Actions
LinkOut - more resources
Full Text Sources
Other Literature Sources
Molecular Biology Databases
