. 2013 Mar 29;288(13):9532-48.
doi: 10.1074/jbc.M112.441238. Epub 2013 Feb 4.

Mammalian myosin-18A, a highly divergent myosin

Affiliations

Mammalian myosin-18A, a highly divergent myosin

Stephanie Guzik-Lendrum et al. J Biol Chem. .

Abstract

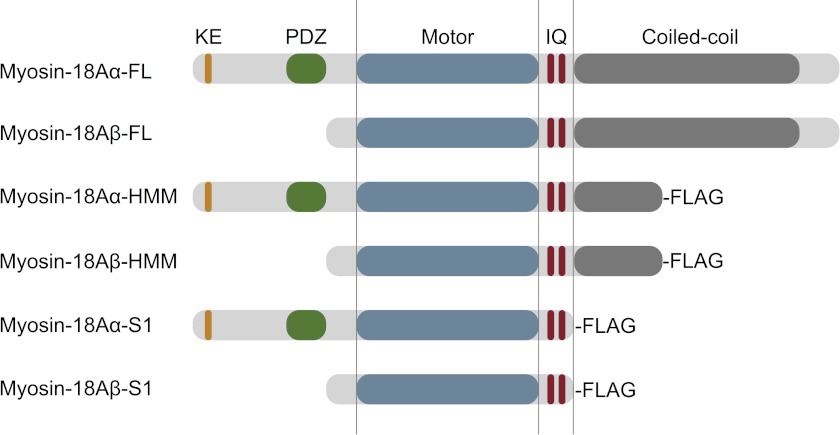
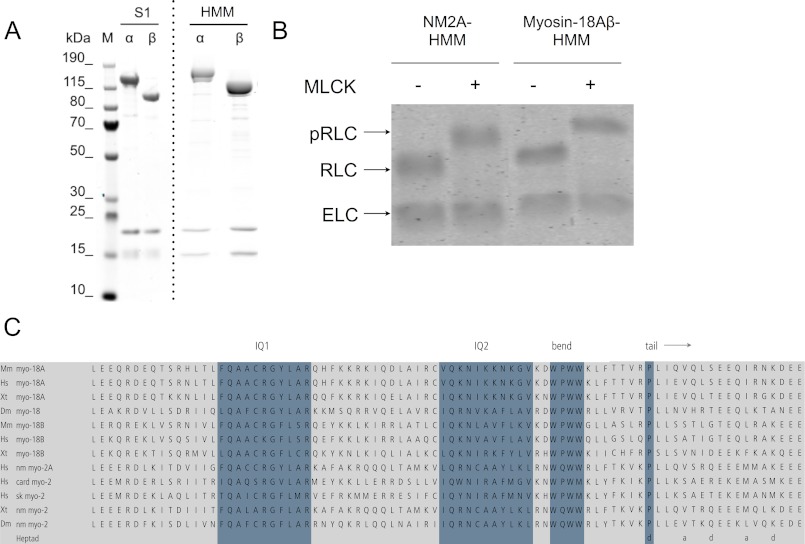
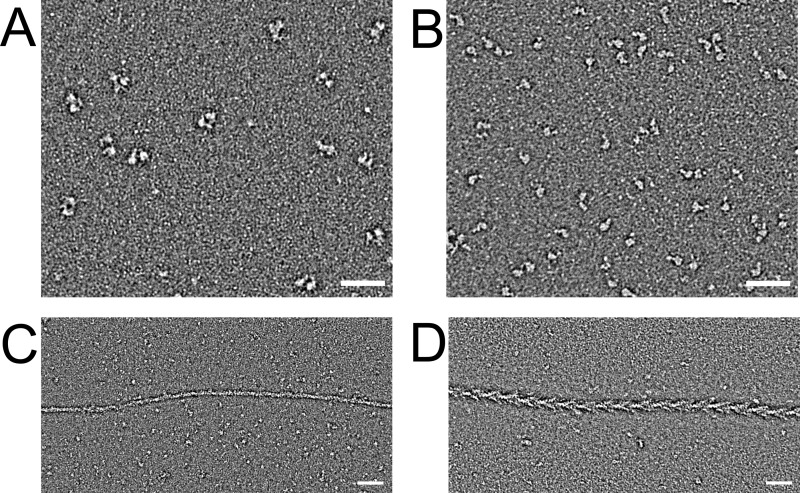
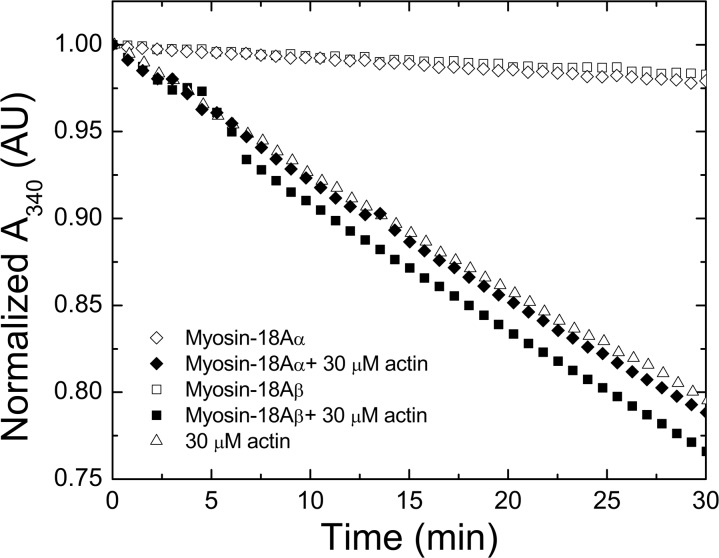
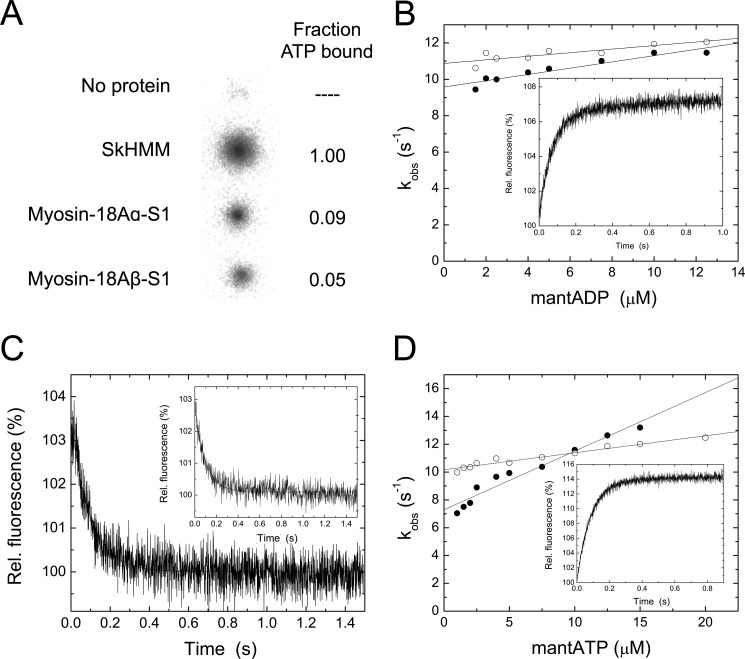
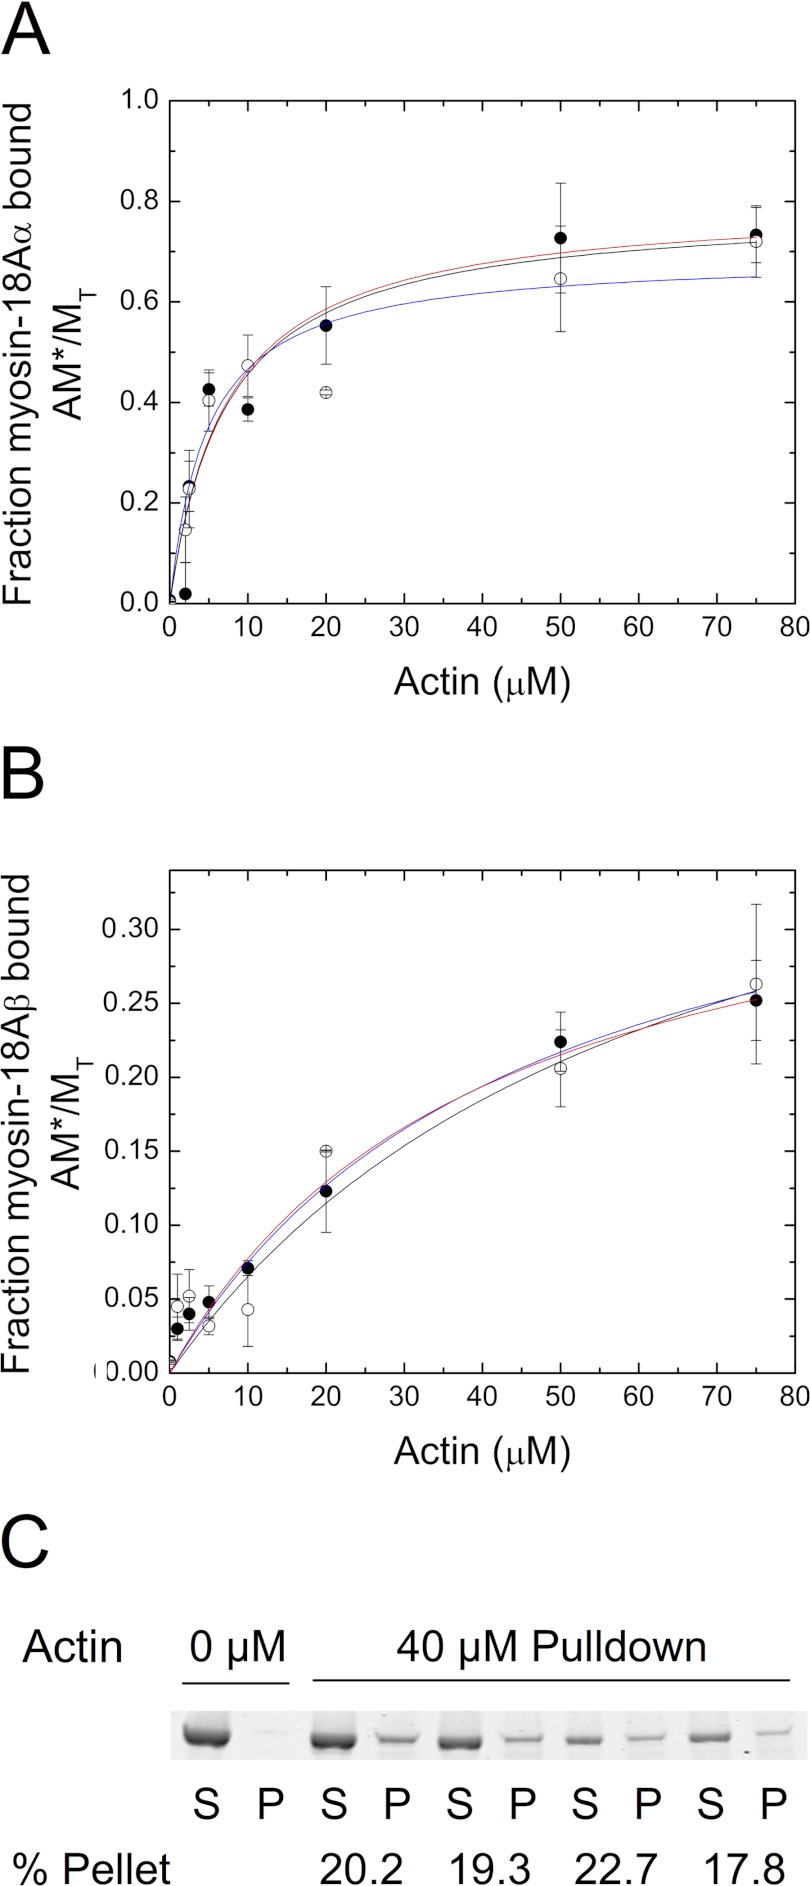
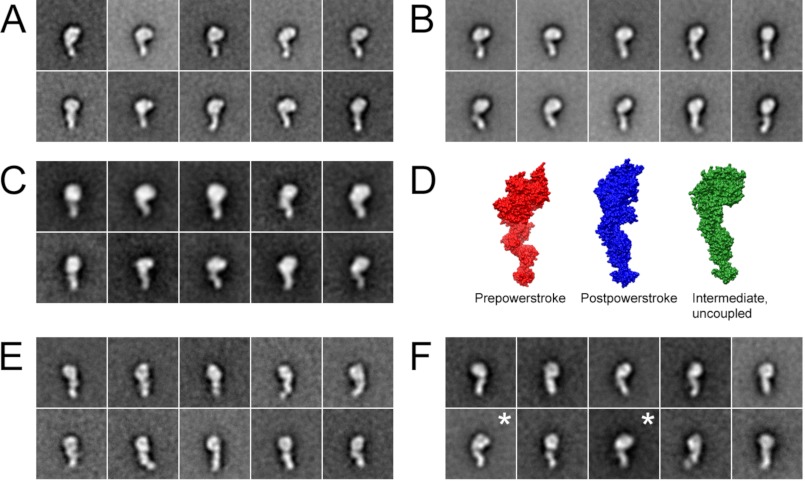
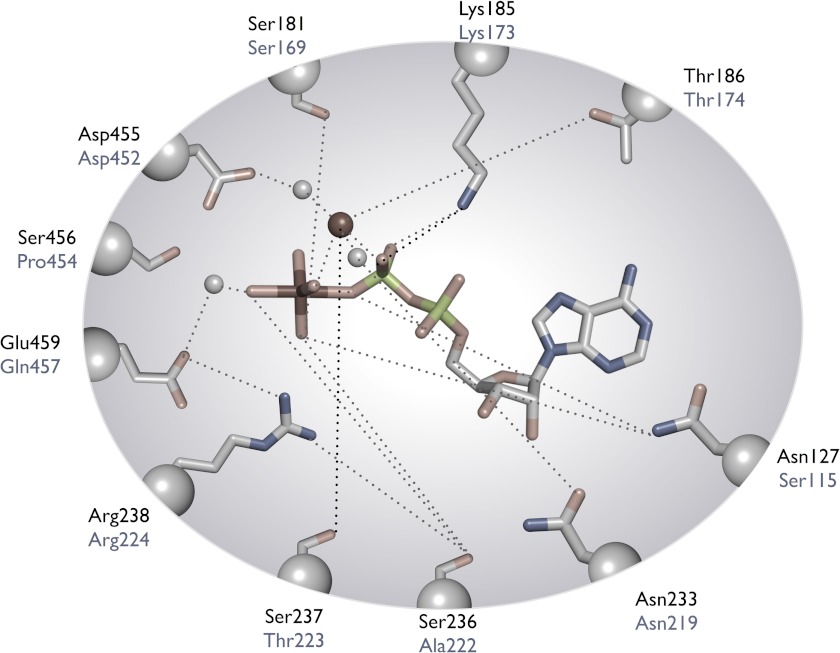
The Mus musculus myosin-18A gene is expressed as two alternatively spliced isoforms, α and β, with reported roles in Golgi localization, in maintenance of cytoskeleton, and as receptors for immunological surfactant proteins. Both myosin-18A isoforms feature a myosin motor domain, a single predicted IQ motif, and a long coiled-coil reminiscent of myosin-2. The myosin-18Aα isoform, additionally, has an N-terminal PDZ domain. Recombinant heavy meromyosin- and subfragment-1 (S1)-like constructs for both myosin-18Aα and -18β species were purified from the baculovirus/Sf9 cell expression system. These constructs bound both essential and regulatory light chains, indicating an additional noncanonical light chain binding site in the neck. Myosin-18Aα-S1 and -18Aβ-S1 molecules bound actin weakly with Kd values of 4.9 and 54 μm, respectively. The actin binding data could be modeled by assuming an equilibrium between two myosin conformations, a competent and an incompetent form to bind actin. Actin binding was unchanged by presence of nucleotide. Both myosin-18A isoforms bound N-methylanthraniloyl-nucleotides, but the rate of ATP hydrolysis was very slow (<0.002 s(-1)) and not significantly enhanced by actin. Phosphorylation of the regulatory light chain had no effect on ATP hydrolysis, and neither did the addition of tropomyosin or of GOLPH3, a myosin-18A binding partner. Electron microscopy of myosin-18A-S1 showed that the lever is strongly angled with respect to the long axis of the motor domain, suggesting a pre-power stroke conformation regardless of the presence of ATP. These data lead us to conclude that myosin-18A does not operate as a traditional molecular motor in cells.


Figures

FIGURE 1.
FIGURE 1.
Domain organization of M. musculus myosin-18A. The domain structure of myosin-18A isoforms was analyzed using SMART (Simple Modular Architecture Research Tool) at EMBL (myosin-18Aα, GenBankTM accession number AB026497; myosin-18Aβ RIKEN clone, GenBankTM accession number AK171342), and the schematic diagrams of the two isoforms were created (top two structures). Using this information, HMM-like constructs with coiled-coil regions truncated at Leu1463 for myosin-18Aα and Leu1128 for myosin-18Aβ were cloned for baculoviral expression. To create single-headed S1-like constructs, the α isoform was truncated at Leu1242, and the 18Aβ isoform was truncated at Leu907. C-terminal FLAG epitopes were added to each construct as an affinity purification aid. Note that these schematics are not drawn to scale.
FIGURE 2.
FIGURE 2.
Overproduction of M. musculus myosin-18A. A, purification of myosin-18A-S1 and -HMM constructs. Lanes are marked as either molecular weight markers (M) or purified fractions of each motor construct. The dashed line indicates that the image is a composite of two separate gel scans. Note that previous studies of nonmuscle myosin 2 and smooth muscle isoforms have revealed that the ELC binds Coomassie dye poorly and always appears lighter in intensity than does the RLC (16, 48). B, confirmation of phosphorylation of the bound RLC using a gel shift Phos-tag assay. Each of the myosin fragments described at the top was either untreated (−) or treated (+) with MLCK to phosphorylate the RLC as described under “Experimental Procedures.” C, alignments of the neck region of representative myosin-18 and myosin-2 heavy chain sequences. Genome sources are M. musculus (Mm), Homo sapiens (Hs), Xenopus tropicalis (Xt), and D. melanogaster (Dm). Myosin-2 H. sapiens genes are MYH9 (nm myo-2A), MYH7 (card myo-2), and MYH4 (sk myo-2). Blue highlighting shows (from left to right) the consensus first IQ motif; the second, more divergent motif that forms the binding site for RLC in the aligned motors; the bend region; and the Pro that marks the end of the neck. The heptad register for the beginning of the coiled-coil motif is shown at the bottom.
FIGURE 3.
FIGURE 3.
Electron microscopic images of myosin-18A fragments. A, field of negatively stained myosin-18Aα HMM molecules. Scale bar, 50 nm. B, field of negatively stained myosin-18Aα-S1 molecules. Scale bar, 50 nm. C, myosin-18Aα-S1 mixed with equimolar actin in the absence of nucleotide demonstrates the weakness of actin binding. D, nonmuscle myosin-2A-S1 mixed with actin under the same conditions shows the classic arrowhead decoration.
FIGURE 4.
FIGURE 4.
The MgATPase activity of myosin-18A isoforms is low and is poorly activated by actin. Time course of ATP hydrolysis measured used an NADH-coupled assay where the decline in absorbance at 340 nm reflects the course of ATP hydrolysis. Open triangle, 30 μm F-actin alone; open diamond, myosin-18Aα-S1 alone; closed diamond, 30 μm actin plus myosin-18Aα-S1; open square, myosin-18Aβ-S1 alone; closed square, myosin-18Aβ-S1 plus 30 μm F-actin. The data were arithmetically normalized to a starting absorbance value of 1.0. Experiments shown were conducted at 25 °C in a buffer containing 50 mm KCl, 10 mm MOPS (pH 7.2), 2 mm MgCl2, 0.15 mm EGTA, 2 mm ATP, 40 units/ml lactate dehydrogenase, 200 units/ml pyruvate kinase, 1 mm phosphoenolpyruvate, and 200 μm NADH. The concentration of myosin-18A motors used in these traces was 1 μm. AU, absorbance units.
FIGURE 5.
FIGURE 5.
Nucleotide interactions of myosin-18A isoforms. A, binding of [α-32P]ATP to rabbit SkHMM, myosin-18Aα-S1, and myosin-18Aβ-S1 in a filter-based assay. The top spot is a no-protein control. See “Experimental Procedures” for methods. The right-hand column demonstrates the relative extent of binding compared with values obtained for SkHMM. B, mantADP binding to myosin-18Aα-S1 (closed circles) and myosin-18Aβ-S1 (open circles) as a function of mantADP concentration. The slopes define the apparent second order rate constants for mantADP binding to myosin-18Aβ-S1 and myosin-18Aβ-S1 of k+D = 0.17 ± 0.02 μm−1 s−1 and k+D = 0.10 ± 0.02 μm−1 s−1. The corresponding y intercepts reflect the ADP dissociation rates (kD = 9.58 ± 0.15 s−1 and kD = 10.87 ± 0.16 s−1 for myosin-18Aα-S1 and -18Aβ-S1. The inset shows a representative trace when a final concentration of 12.5 μm mantADP is mixed with 0.25 μm myosin-18Aα-S1. The single exponential fit to the data gave a rate of 11.5 s−1. C, representative fluorescence decay observed after mixing myosin-18A-S1·mantADP with excess ATP. Release rate constants of kD = 10.01 ± 0.23 s−1 and kD = 10.30 ± 0.30 s−1 were obtained for myosin-18Aα (inset) and myosin-18Aβ from single-exponential fits to the data. D, mantATP binding to myosin-18Aα-S1 (closed circles) and myosin-18Aβ-S1 (open circles) as a function of mantATP concentration. Second order rate constants for mantATP binding (KT) were calculated from the slopes to be 0.42 ± 0.03 μm−1 s−1 and 0.12 ± 0.01 μm−1 s−1 for myosin-18Aα-S1 and myosin-18Aβ-S1, respectively. ATP dissociation rate constants of k−T = 7.29 ± 0.26 s−1 for myosin-18Aα and k−T = 10.16 ± 0.09 s−1 for myosin-18Aβ-S1 were deduced from the ordinate intercepts. The inset shows a representative trace when a final concentration of 10 μm mantATP is mixed with 0.25 μm myosin-18Aβ-S1. The single exponential fit to the data gave a rate of 11.4 s−1.
FIGURE 6.
FIGURE 6.
Binding of myosin-18A isoforms to actin. A, binding of myosin-18Aα-S1 to actin at a final concentration of 1 μm motor in the presence (open circles) or absence (closed circles) of 1 mm ATP. Conditions were as follows: 0.1 m KCl, 20 mm MOPS (pH 7.0), 5 mm MgCl2, 0.05 mm EGTA, 1 mm NaN3, and 1 mm DTT, actin concentrations as indicated and ATP present or not. Kd values were obtained by fitting the data to a rectangular hyperbolic function, AM*/MT = (AM*/MT)max × A/(Kd + A). Values were Kd = 5.9 ± 1.7 μm in the absence of ATP (red curve) and Kd = 4.9 ± 1.6 μm in the presence of 1 mm ATP (blue curve) for myosin-18Aα-S1. For these experiments, myosin-18Aα-S1 binding saturated at 77 ± 5% bound in the absence of nucleotide and at 69 ± 6% in the presence of ATP. B, binding of myosin-18Aβ-S1 to actin. In the absence of ATP (closed circles), Kd = 47.9 ± 9.2 μm (red curve), and in the presence of 1 mm ATP (open circles), Kd = 41 ± 4 μm (blue curve). For myosin-18Aβ, saturation of binding occurred at 44 ± 12% in the absence of ATP, and in the presence of 1 mm ATP, saturation occurred at 24.5 ± 7.1%. In both A and B, the black lines shown are the simulation of the binding data using the model described in Scheme 1. Rate constants used for the simulations were as follows: k1 = 0.001 s−1, k−1 = 0.00012−1 s, k2 = 2.5 × 10⁶ m−1 s−1, k−2 = 10 s−1 for the interaction of myosin-18Aα-S1 with actin and k1 = 0.0005 s−1, k−1 = 0.0045 s−1, k2 = 7.5 × 10⁵ m−1 s−1, k−2 = 10 s−1 for the interaction of myosin-18Aβ-S1 with actin. C, sequential actin rebinding experiments. Lanes 1 and 2, supernatant (S) and pellet (P) of myosin-18Aβ-S1 sedimented in the absence of actin. Lanes 3 and 4, supernatant and pellet of myosin-18A-S1 sedimented in the presence of 40 μm actin. Lanes 5 and 6, the supernatant from the first sedimentation was mixed with 40 μm actin and sedimented to give supernatant and pellet fractions. Lanes 7 and 8, the supernatant from the second sedimentation was mixed with 40 μm actin and sedimented to give supernatant and pellet fractions. Lanes 9 and 10, the supernatant from the third sedimentation was mixed with 40 μm actin and sedimented to give supernatant and pellet fractions. The percentage of myosin-18Aβ-S1 found in the pellet is given below the pairs of lanes for each experiment. Error bars, S.D.
FIGURE 7.
FIGURE 7.
Optical trapping analysis of myosin-18A interactions. Actomyosin attachment lifetime data of myosin-18Aα-HMM (A) and myosin-18Aβ-HMM interactions (B) collected in the optical trap were fitted to a single exponential curve. Myosin-18Aα-HMM (A) yielded a detachment rate of 16.7 ± 0.4 s−1, and myosin-18Aβ-HMM (B) yielded a detachment rate of 19.7 ± 0. 3s−1. Insets in A and B show the time axis extended to 1 s instead of 0.3 s. C, actomyosin-18Aα-HMM displacement data from the optical trap were fit to a Gaussian distribution centered at 0.5 ± 0.4 nm. D, actomyosin-18Aβ-HMM displacement data from the optical trap were fit to a Gaussian distribution centered at 0.9 ± 0.3 nm. No significant displacements (i.e. power strokes) were observed for either construct. Data were collected at 20 °C in a buffer containing 25 mm KCl, 25 mm imidazole (pH 7.4), 4 mm MgCl2, 1 mm EGTA, 2 mm creatine phosphate, 50 mm DTT, 1 mm ATP, 0.1 mg/ml creatine phosphokinase, 3 mg/ml glucose, 0.1 mg/ml glucose oxidase, and 0.02 mg/ml catalase. The number of actomyosin-18Aα-HMM interactions was 1804, and the number of actomyosin-18Aβ-HMM interactions was 697.
FIGURE 8.
FIGURE 8.
Myosin-18A attenuates the motility of actively cycling SkHMM in vitro. Keeping the final myosin motor concentration in the assay at 0.2 mg/ml, increasing concentrations of murine myosin-18Aα-HMM (closed circles) or myosin-18Aβ-HMM (open circles) were premixed with SkHMM prior to binding to the coverslip surface. The rate of actin filament sliding was measured by centroid tracking from the CellTrak program (Motion Analysis). The translocation speed of SkHMM alone, which varied between preparations from 4.5 to 7.2 μm s−1, was used for normalization. Assays were performed at 30 °C in buffer containing 50 mm KCl, 20 mm MOPS (pH 7.4), 5 mm MgCl2, 0.1 mm EGTA, 1 mm ATP, 25 μg/ml glucose oxidase, 45 μg/ml catalase, 2.5 mg/ml glucose, and 50 mm DTT. Error bars, S.D.
FIGURE 9.
FIGURE 9.
The gross conformation of myosin-18A is not affected by nucleotide. Shown are class averages of myosin-18Aα S1 (1108 molecules) (A) and myosin-18Aβ-S1 (1341 molecules) (B) in the absence of nucleotide. C, myosin-18Aα S1 in the presence of ATP (n = 817). C, surface representations showing the three major conformations of Argopectan irradians myosin 2 S1 determined by x-ray crystallography. Crystal structures are oriented to show the most similarity to class averages. Red, pre-power stroke state (Protein Data Bank entry 1QVI) (69); blue, near rigor state (Protein Data Bank entry 1SR6) (70); green, internally uncoupled state (Protein Data Bank entry 1KK8) (71). Images were prepared using UCSF Chimera. Shown are class averages of myosin 2B-S1 in the absence (786 molecules) (E) and presence of ATP (933 molecules) (F). The ATP concentration was 1 mm when present.
FIGURE 10.
FIGURE 10.
Homology model of myosin-18A structure. A, structural overview of the myosin-18A motor domain based on a homology modeling approach. The nucleotide is shown in brown. B, selected view of the superposition of myosin-18A and Dictyostelium myosin-2 activation loops. The myosin-18A activation loop (blue) is longer than that of Dictyostelium myosin-2 (green). C, amino acid alignment of the activation loop of myosin-18A compared with other myosins. Genome sources are M. musculus (Mm), D. discoideum (Dd), Gallus gallus (Gg), and Sus scrofus (Ss). sm myo-2, smooth muscle myosin-2.
FIGURE 11.
FIGURE 11.
Comparison of active site residues of myosin-18Aβ with those of Dictyostelium myosin-2. Amino acid residues in black are from Dictyostelium myosin-2, whereas those in gray are from myosin-18Aβ. This figure was adapted from Sellers (33).
FIGURE 12.
FIGURE 12.
Sequence/structural alignment showing consensus sequence motifs and myosin-18A-specific insertions within myosin motor domains. A, alignment of P-loop, switch-1, and switch-2 regions. Overall, the alignment indicates a high degree of conservation in this triad of nucleotide-interacting loops (P-loop, switch-1, and switch-2) across the myosin superfamily and highlights the exceptional role/deviation of myosin-18A, which accounts for its unique kinetic properties. B, alignment of a region of myosins in which myosin-18A contains a unique myosin-18A-specific extension (myosin-18A loop) within the myosin motor domain, which does not share any homology to other myosins identified so far. In both A and B, blue indicates the position of the typically invariantly conserved glycine residue, which is an arginine residue in myosin-18A; orange indicates myosin-18A-specific amino acid sequences. Genome sources are M. musculus (Mm), D. discoideum (Dd), G. gallus (Gg), A. irradians (Ai), Placopecten magellanicus (Pm), and S. scrofa (Ss). sm myo-2, smooth muscle myosin 2; st myo-2, striated muscle myosin 2.

References

    1. Odronitz F., Kollmar M. (2007) Drawing the tree of eukaryotic life based on the analysis of 2,269 manually annotated myosins from 328 species. Genome Biol. 8, R196. - PMC - PubMed
    1. Sellers J. R. (2000) Myosins. A diverse superfamily. Biochim. Biophys. Acta 1496, 3–22 - PubMed
    1. Furusawa T., Ikawa S., Yanai N., Obinata M. (2000) Isolation of a novel PDZ-containing myosin from hematopoietic supportive bone marrow stromal cell lines. Biochem. Biophys. Res. Commun. 270, 67–75 - PubMed
    1. Doyle D. A., Lee A., Lewis J., Kim E., Sheng M., MacKinnon R. (1996) Crystal structures of a complexed and peptide-free membrane protein-binding domain. Molecular basis of peptide recognition by PDZ. Cell 85, 1067–1076 - PubMed
    1. Mori K., Furusawa T., Okubo T., Inoue T., Ikawa S., Yanai N., Mori K. J., Obinata M. (2003) Genome structure and differential expression of two isoforms of a novel PDZ-containing myosin (MysPDZ) (Myo18A). J. Biochem. 133, 405–413 - PubMed

MeSH terms

LinkOut - more resources