

Observing micro-evolutionary processes of viral populations at multiple scales
- PMID: 23382425
- PMCID: PMC3678327
- DOI: 10.1098/rstb.2012.0203
Observing micro-evolutionary processes of viral populations at multiple scales
Abstract
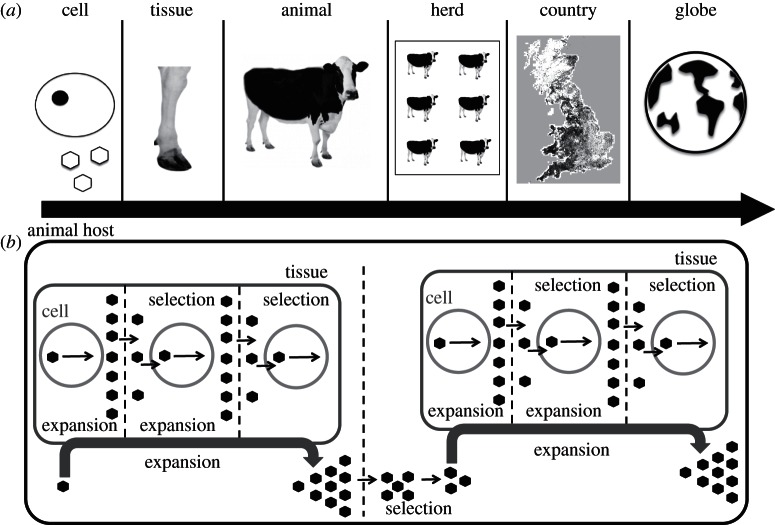
Advances in sequencing technology coupled with new integrative approaches to data analysis provide a potentially transformative opportunity to use pathogen genome data to advance our understanding of transmission. However, to maximize the insights such genetic data can provide, we need to understand more about how the microevolution of pathogens is observed at different scales of biological organization. Here, we examine the evolutionary processes in foot-and-mouth disease virus observed at different scales, ranging from the tissue, animal, herd and region. At each scale, we observe analogous processes of population expansion, mutation and selection resulting in the accumulation of mutations over increasing time scales. While the current data are limited, rates of nucleotide substitution appear to be faster over individual-to-individual transmission events compared with those observed at a within-individual scale suggesting that viral population bottlenecks between individuals facilitate the fixation of polymorphisms. Longer-term rates of nucleotide substitution were found to be equivalent in individual-to-individual transmission compared with herd-to-herd transmission indicating that viral diversification at the herd level is not retained at a regional scale.
Figures
Similar articles
-
The impact of within-herd genetic variation upon inferred transmission trees for foot-and-mouth disease virus.Infect Genet Evol. 2015 Jun;32:440-8. doi: 10.1016/j.meegid.2015.03.032. Epub 2015 Apr 8. Infect Genet Evol. 2015. PMID: 25861750 Free PMC article.
-
Investigating intra-host and intra-herd sequence diversity of foot-and-mouth disease virus.Infect Genet Evol. 2016 Oct;44:286-292. doi: 10.1016/j.meegid.2016.07.010. Epub 2016 Jul 12. Infect Genet Evol. 2016. PMID: 27421209 Free PMC article.
-
Evolution of foot-and-mouth disease virus intra-sample sequence diversity during serial transmission in bovine hosts.Vet Res. 2013 Mar 1;44(1):12. doi: 10.1186/1297-9716-44-12. Vet Res. 2013. PMID: 23452550 Free PMC article.
-
Understanding the molecular epidemiology of foot-and-mouth-disease virus.Infect Genet Evol. 2009 Mar;9(2):153-61. doi: 10.1016/j.meegid.2008.11.005. Epub 2008 Nov 28. Infect Genet Evol. 2009. PMID: 19100342 Free PMC article. Review.
-
Evolution of foot-and-mouth disease virus.Virus Res. 2003 Jan;91(1):47-63. doi: 10.1016/s0168-1702(02)00259-9. Virus Res. 2003. PMID: 12527437 Review.
Cited by
-
The impact of within-herd genetic variation upon inferred transmission trees for foot-and-mouth disease virus.Infect Genet Evol. 2015 Jun;32:440-8. doi: 10.1016/j.meegid.2015.03.032. Epub 2015 Apr 8. Infect Genet Evol. 2015. PMID: 25861750 Free PMC article.
-
Next-generation sequencing in veterinary medicine: how can the massive amount of information arising from high-throughput technologies improve diagnosis, control, and management of infectious diseases?Methods Mol Biol. 2015;1247:415-36. doi: 10.1007/978-1-4939-2004-4_30. Methods Mol Biol. 2015. PMID: 25399113 Free PMC article. Review.
-
Investigating intra-host and intra-herd sequence diversity of foot-and-mouth disease virus.Infect Genet Evol. 2016 Oct;44:286-292. doi: 10.1016/j.meegid.2016.07.010. Epub 2016 Jul 12. Infect Genet Evol. 2016. PMID: 27421209 Free PMC article.
-
Estimating viral bottleneck sizes for FMDV transmission within and between hosts and implications for the rate of viral evolution.Interface Focus. 2020 Feb 6;10(1):20190066. doi: 10.1098/rsfs.2019.0066. Epub 2019 Dec 13. Interface Focus. 2020. PMID: 31897294 Free PMC article.
-
Changes in diversification patterns and signatures of selection during the evolution of murinae-associated hantaviruses.Viruses. 2014 Mar 10;6(3):1112-34. doi: 10.3390/v6031112. Viruses. 2014. PMID: 24618811 Free PMC article.
References
-
- Holland J, Spindler K, Horodyski F, Grabau E, Nichol S, VandePol S. 1982. Rapid evolution of RNA genomes. Science 215, 1577–1585 (doi:10.1126/science.7041255) - DOI - PubMed
-
- Drake JW. 1993. Rates of spontaneous mutation among RNA viruses. Proc. Natl Acad. Sci. USA 90, 4171–4175 (doi:10.1073/pnas.90.9.4171) - DOI - PMC - PubMed
-
- Duffy S, Shackelton LA, Holmes EC. 2008. Rates of evolutionary change in viruses: patterns and determinants. Nat. Rev. Genet. 9, 267–276 (doi:10.1038/nrg2323) - DOI - PubMed
-
- Sanjuan R. 2010. Mutational fitness effects in RNA and single-stranded DNA viruses: common patterns revealed by site-directed mutagenesis studies. Phil. Trans. R. Soc. B 365, 1975–1982 (doi:10.1098/rstb.2010.0063) - DOI - PMC - PubMed
-
- Eigen M. 1971. Selforganization of matter and the evolution of biological macromolecules. Naturwissenschaften 58, 465–523 (doi:10.1007/BF00623322) - DOI - PubMed
Publication types
MeSH terms
Grants and funding
- BB/K004484/1/BB_/Biotechnology and Biological Sciences Research Council/United Kingdom
- BB/F005733/1/BB_/Biotechnology and Biological Sciences Research Council/United Kingdom
- BB/I013784/1/BB_/Biotechnology and Biological Sciences Research Council/United Kingdom
- BB/E018505/1/BB_/Biotechnology and Biological Sciences Research Council/United Kingdom
- BB/I014314/1/BB_/Biotechnology and Biological Sciences Research Council/United Kingdom
LinkOut - more resources
Full Text Sources
Other Literature Sources
