Modelling tree shape and structure in viral phylodynamics
- PMID: 23382430
- PMCID: PMC3678332
- DOI: 10.1098/rstb.2012.0208
Modelling tree shape and structure in viral phylodynamics
Abstract
Epidemiological models have highlighted the importance of population structure in the transmission dynamics of infectious diseases. Using HIV-1 as an example of a model evolutionary system, we consider how population structure affects the shape and the structure of a viral phylogeny in the absence of strong selection at the population level. For structured populations, the number of lineages as a function of time is insufficient to describe the shape of the phylogeny. We develop deterministic approximations for the dynamics of tips of the phylogeny over evolutionary time, the number of 'cherries', tips that share a direct common ancestor, and Sackin's index, a commonly used measure of phylogenetic imbalance or asymmetry. We employ cherries both as a measure of asymmetry of the tree as well as a measure of the association between sequences from different groups. We consider heterogeneity in infectiousness associated with different stages of HIV infection, and in contact rates between groups of individuals. In the absence of selection, we find that population structure may have relatively little impact on the overall asymmetry of a tree, especially when only a small fraction of infected individuals is sampled, but may have marked effects on how sequences from different subpopulations cluster and co-cluster.
Figures


 ,
,  ,
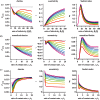
,  , S(0) = 9999, I(0) = 1, with a simulation time of 40 years. Simulations of the differential equations were performed using the

 (red) to
  (violet) in steps of 0.1, for different values of the relative infectiousness of acute infection (a), and the relative contact rate in the differential risk model, assuming either (b) proportionate mixing (ρ = 0) or (c) preferential mixing (ρ = 0.9). Parameter values for the acute/chronic model are as follows: c = 1,
  ,
,  ,
,  ,
,  , S(0) = 9999, I1(0) = 1, I2(0) = 0. The infectivity parameters βi were constrained such that
  and
and  , where
  is the mean infectiousness (with
  ), di the mean duration of stage i and k the fold increase in infectiousness during acute infection. Parameter values for the differential risk model are β = 0.01, c2 = 1,
  ,
,  ,
,  ,
,  , S1(0) = 999, I1(0) = 1, S2(0) = 9000, I2(0) = 0. The simulation time is 30 years, with weekly timesteps, assuming 52 weeks per year.
References
-
- Pybus OG, Rambaut A. 2009. Evolutionary analysis of the dynamics of viral infectious disease. Nat. Rev. Genet. 10, 540–550 (doi:10.1038/nrg2583) - DOI - PMC - PubMed
-
- Grenfell BT, et al. 2004. Unifying the epidemiological and evolutionary dynamics of pathogens. Science 303, 327–332 (doi:10.1126/science.1090727) - DOI - PubMed
-
- Frost SDW, Volz EM. 2010. Viral phylodynamics and the search for an ‘effective number of infections’. Phil. Trans. R. Soc. B 365, 1879–1890 (doi:10.1098/rstb.2010.0060) - DOI - PMC - PubMed
-
- Hué S, Pillay D, Clewley JP, Pybus OG. 2005. Genetic analysis reveals the complex structure of HIV-1 transmission within defined risk groups. Proc. Natl Acad. Sci. USA 102, 4425–4429 (doi:10.1073/pnas.0407534102) - DOI - PMC - PubMed
-
- Lewis F, Hughes GJ, Rambaut A, Pozniak A, Brown AJL. 2008. Episodic sexual transmission of HIV revealed by molecular phylodynamics. PLoS Med. 5, e50 (doi:10.1371/journal.pmed.0050050) - DOI - PMC - PubMed
Publication types
MeSH terms
Grants and funding
LinkOut - more resources
Full Text Sources
Other Literature Sources
Medical

