

The evolutionary dynamics of influenza A virus adaptation to mammalian hosts
- PMID: 23382435
- PMCID: PMC3678336
- DOI: 10.1098/rstb.2012.0382
The evolutionary dynamics of influenza A virus adaptation to mammalian hosts
Abstract
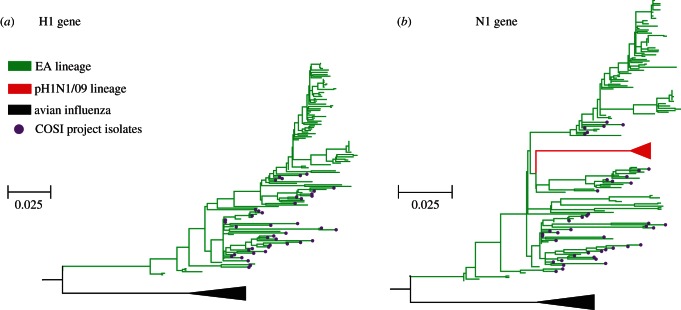
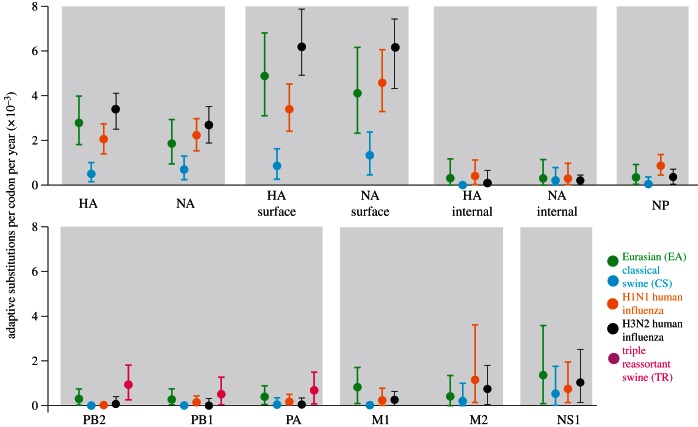
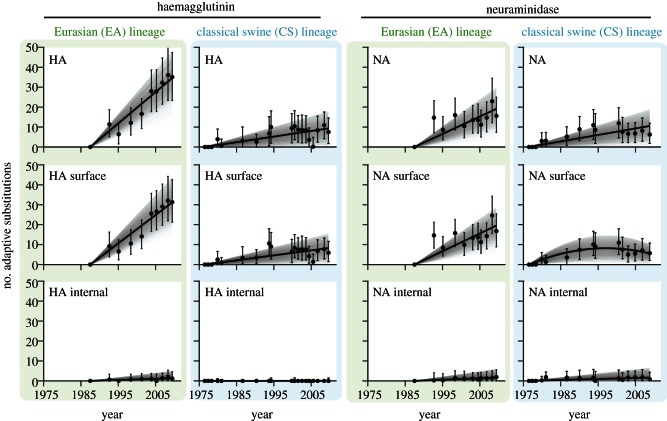
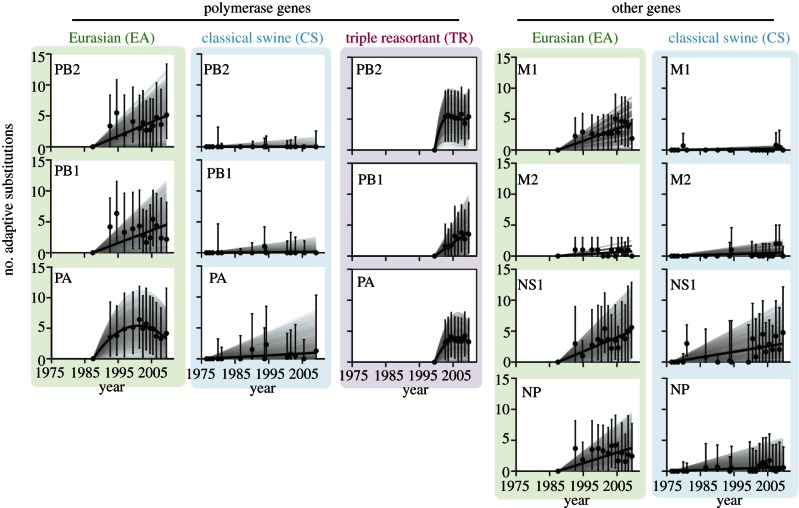
Few questions on infectious disease are more important than understanding how and why avian influenza A viruses successfully emerge in mammalian populations, yet little is known about the rate and nature of the virus' genetic adaptation in new hosts. Here, we measure, for the first time, the genomic rate of adaptive evolution of swine influenza viruses (SwIV) that originated in birds. By using a curated dataset of more than 24 000 human and swine influenza gene sequences, including 41 newly characterized genomes, we reconstructed the adaptive dynamics of three major SwIV lineages (Eurasian, EA; classical swine, CS; triple reassortant, TR). We found that, following the transfer of the EA lineage from birds to swine in the late 1970s, EA virus genes have undergone substantially faster adaptive evolution than those of the CS lineage, which had circulated among swine for decades. Further, the adaptation rates of the EA lineage antigenic haemagglutinin and neuraminidase genes were unexpectedly high and similar to those observed in human influenza A. We show that the successful establishment of avian influenza viruses in swine is associated with raised adaptive evolution across the entire genome for many years after zoonosis, reflecting the contribution of multiple mutations to the coordinated optimization of viral fitness in a new environment. This dynamics is replicated independently in the polymerase genes of the TR lineage, which established in swine following separate transmission from non-swine hosts.
Figures
References
-
- Claas EC, Kawaoka Y, de Jong JC, Masurel N, Webster RG. 1994. Infection of children with avian–human reassortant influenza virus from pigs in Europe. Virology 204, 453–457 (doi:10.1006/viro.1994.1553) - DOI - PubMed
-
- Ferguson NM, Fraser C, Donnelly CA, Ghani AC, Anderson RM. 2004. Public health risk from the avian H5N1 influenza epidemic. Science 304, 968–969 (doi:10.1126/science.1096898) - DOI - PubMed
-
- Campitelli L, Donatelli I, Foni E, Castrucci MR, Fabiani C, Kawaoka Y, Krauss S, Webster RG. 1997. Continued evolution of H1N1 and H3N2 influenza viruses in pigs in Italy. Virology 232, 310–318 (doi:10.1006/viro.1997.8514) - DOI - PubMed
Publication types
MeSH terms
Substances
Grants and funding
- BB/H014306/1/BB_/Biotechnology and Biological Sciences Research Council/United Kingdom
- BB/E009670/1/BB_/Biotechnology and Biological Sciences Research Council/United Kingdom
- 709/DH_/Department of Health/United Kingdom
- WT_/Wellcome Trust/United Kingdom
- MC_G0902096/MRC_/Medical Research Council/United Kingdom
LinkOut - more resources
Full Text Sources
Other Literature Sources
