. 2013 Feb 4;200(3):301-20.
doi: 10.1083/jcb.201204092.

Myosin VI small insert isoform maintains exocytosis by tethering secretory granules to the cortical actin

Affiliations

Myosin VI small insert isoform maintains exocytosis by tethering secretory granules to the cortical actin

Vanesa M Tomatis et al. J Cell Biol. .

Abstract

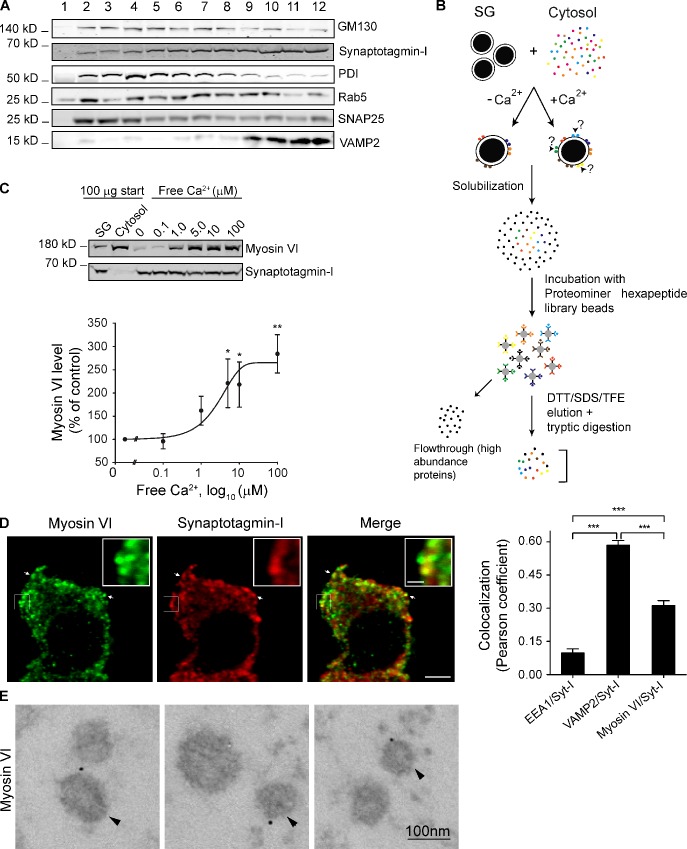
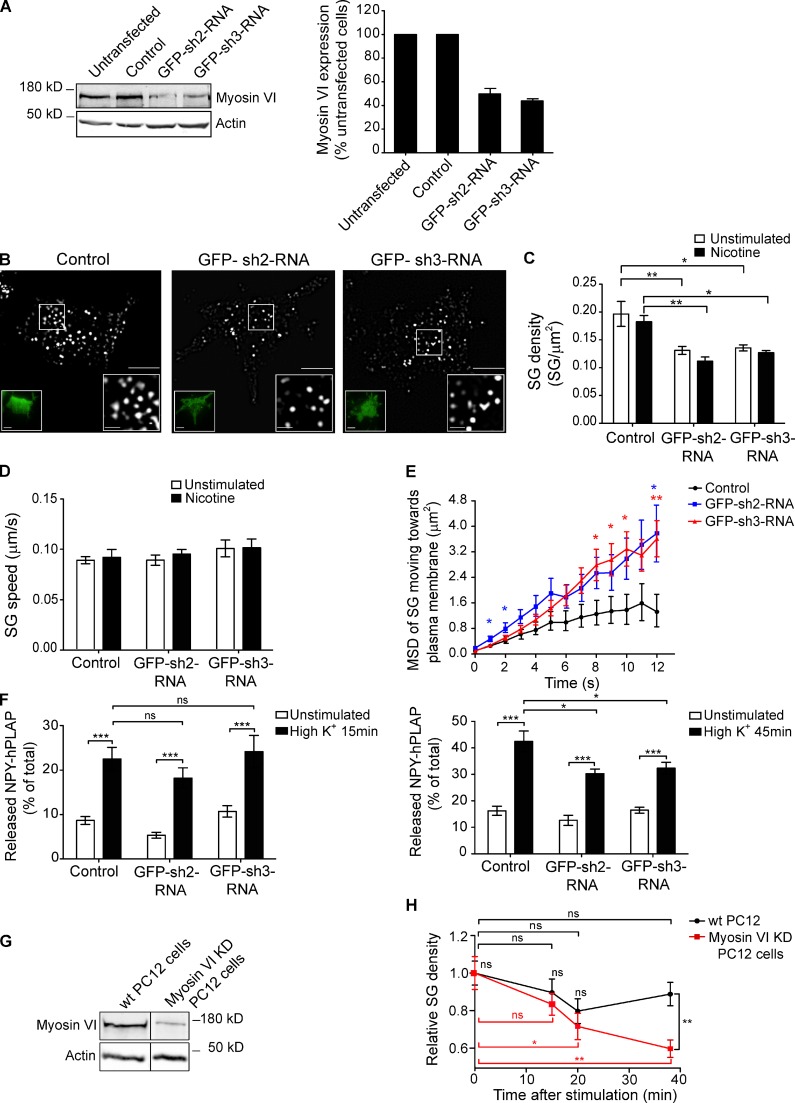
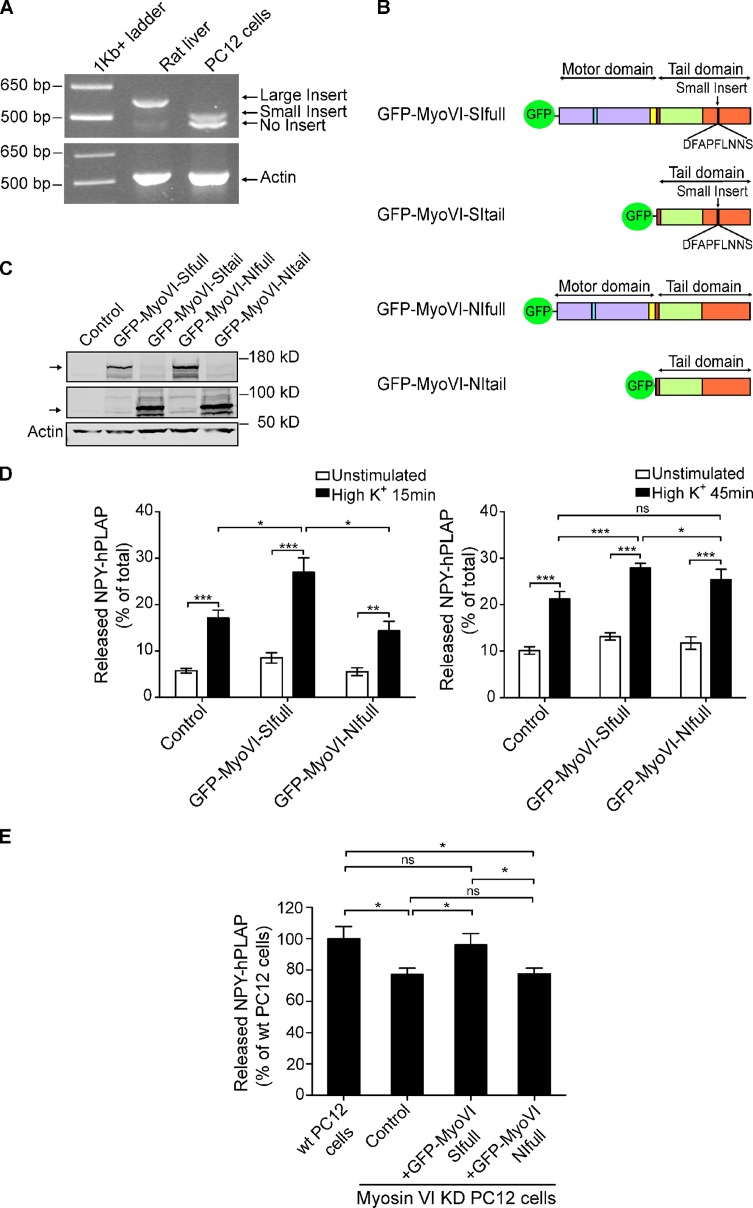
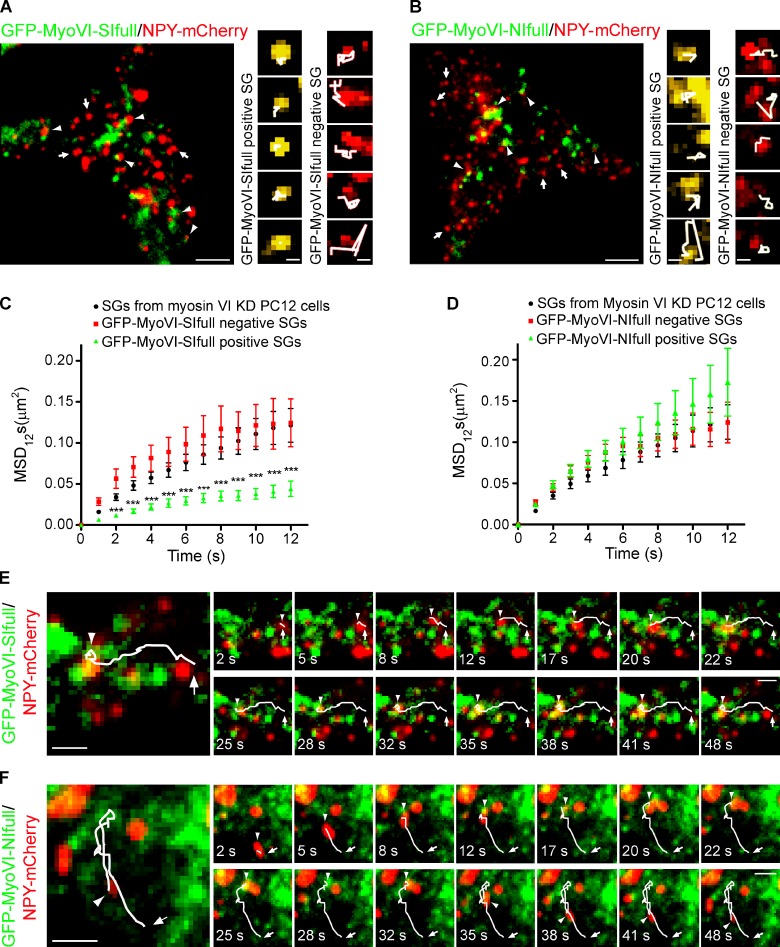
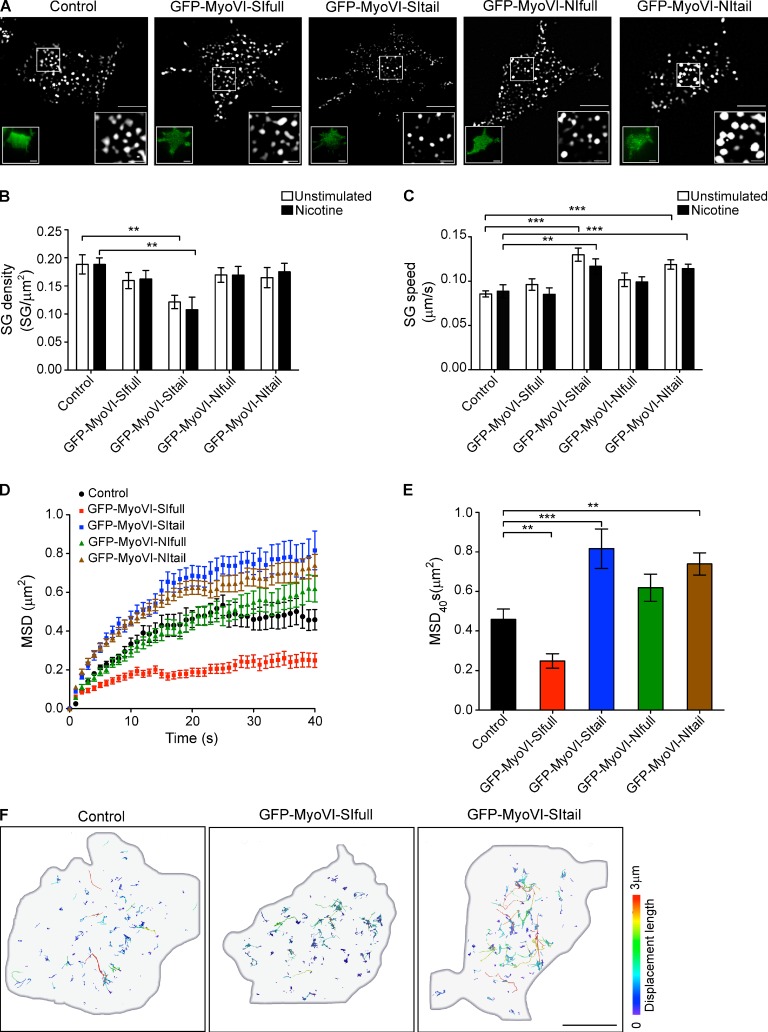
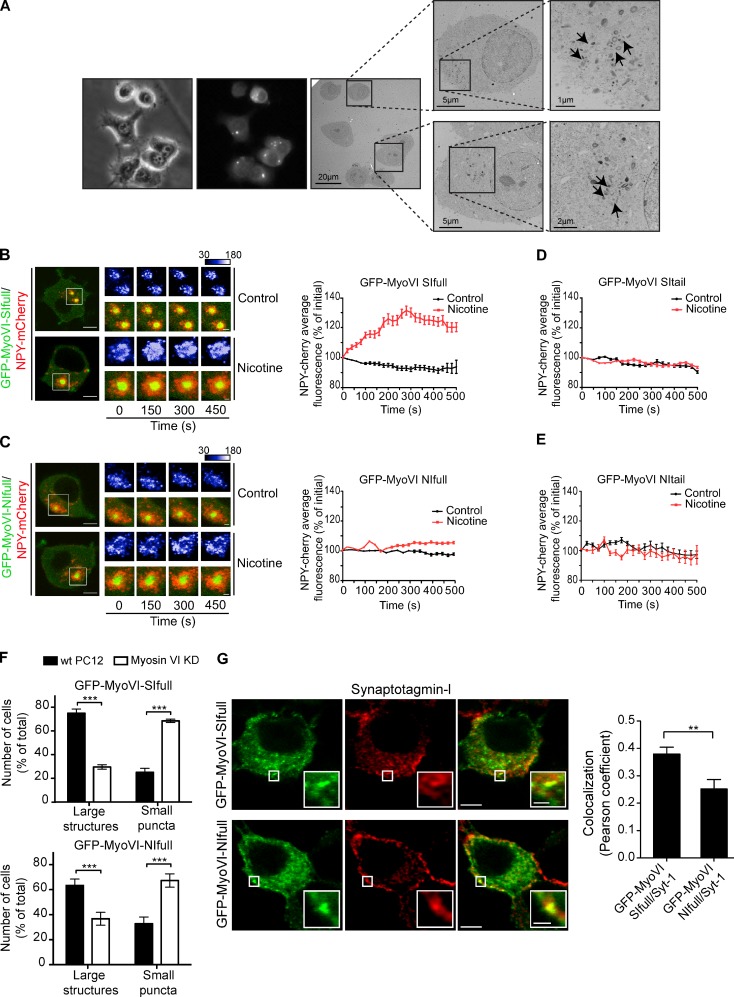
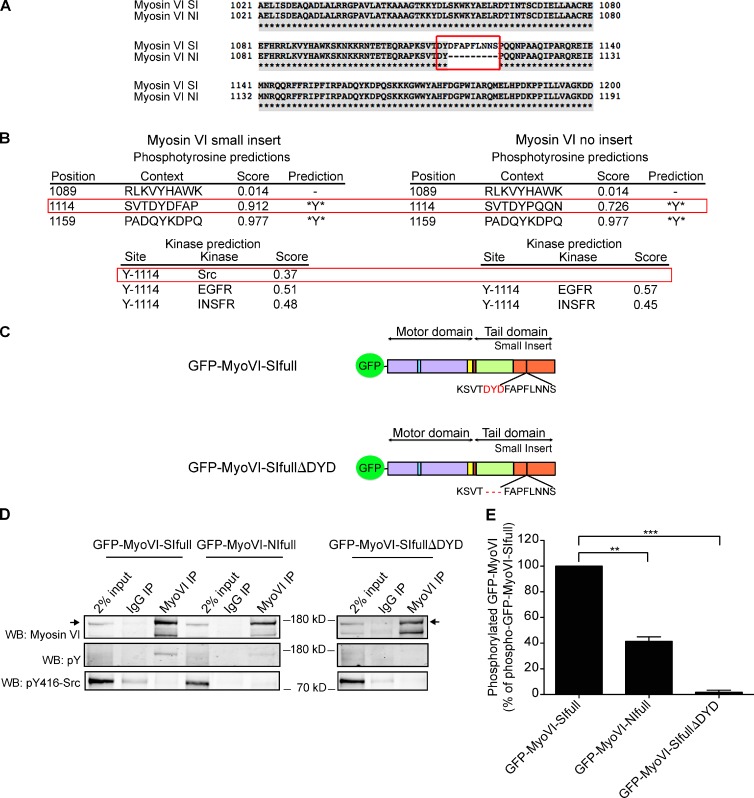
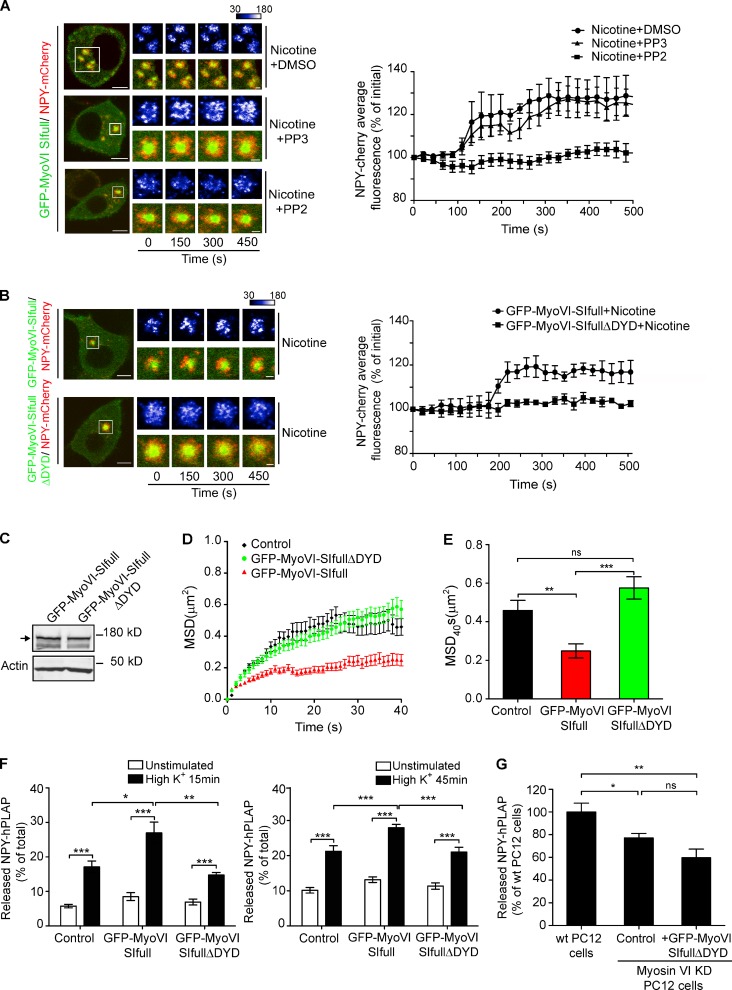
Before undergoing neuroexocytosis, secretory granules (SGs) are mobilized and tethered to the cortical actin network by an unknown mechanism. Using an SG pull-down assay and mass spectrometry, we found that myosin VI was recruited to SGs in a Ca(2+)-dependent manner. Interfering with myosin VI function in PC12 cells reduced the density of SGs near the plasma membrane without affecting their biogenesis. Myosin VI knockdown selectively impaired a late phase of exocytosis, consistent with a replenishment defect. This exocytic defect was selectively rescued by expression of the myosin VI small insert (SI) isoform, which efficiently tethered SGs to the cortical actin network. These myosin VI SI-specific effects were prevented by deletion of a c-Src kinase phosphorylation DYD motif, identified in silico. Myosin VI SI thus recruits SGs to the cortical actin network, potentially via c-Src phosphorylation, thereby maintaining an active pool of SGs near the plasma membrane.


Figures

Figure 1.
Figure 1.
Myosin VI interacts with SGs in a Ca2+-dependent manner. (A) Bovine adrenal medulla fractionation was assessed by SDS-PAGE and Western blotting with the indicated antibodies (Golgi: GM130; early endosomes: Rab5; endoplasmic reticulum: protein disulfide-isomerase (PDI); plasma membrane: SNAP25; and SG: Synaptotagmin-I and VAMP2). Purified SGs were obtained by pooling fractions 11 and 12. (B) Schematic representation of the experimental approach used to identify cytosolic proteins interacting with SGs in a Ca2+-dependent manner. (C, top) Purified SGs and cytosol were incubated in the presence of increasing free [Ca2+]. Myosin VI recruitment to SGs was analyzed by Western blotting. Synaptotagmin-I was used as a loading control. (bottom) Quantification of myosin VI recruitment to SGs (n = 3). (D, left) PC12 cells immunolabeled with anti–myosin VI (green) and anti–Synaptotagmin-I (red) antibodies. Arrows mark colabeled SGs. The enlarged images (insets) show the association between endogenous myosin VI and Synaptotagmin-I. Bars: (main images) 5 µm; (insets) 1 µm. (right) Analysis of the colocalization between Synaptotagmin-I (Syt-I) and myosin VI, EEA1, or VAMP2. (E) Paraformaldehyde-fixed PC12 cells were immunolabeled with the anti–myosin VI antibody and labeled with 5-nm protein A–gold for EM. Arrowheads show myosin VI–positive SGs. Error bars are means ± SEM. *, P < 0.05; **, P < 0.01; ***, P < 0.001.
Figure 2.
Figure 2.
Myosin VI knockdown impairs the maintenance of exocytosis. (A, left) Analysis of myosin VI expression levels by Western blotting with an anti–myosin VI antibody in untransfected PC12 cells, cells transfected with GFP-scrambled shRNA (control), and cells transfected with GFP-shRNA against myosin VI (GFP–sh2-RNA and GFP–sh3-RNA). Anti–β-actin was used as a loading control. (right) Quantification of the expression level of myosin VI (n = 6). (B) TIRF images of NPY-mCherry (pseudocolored gray) in PC12 cotransfected with GFP–scrambled-shRNA (control), GFP–sh2-RNA, or GFP–sh3-RNA. Left insets show the respective GFP-shRNA expression. The enlarged images on the right highlight a fixed area for comparison of SG density. Bars: (main images and left insets) 5 µm; (right insets) 1 µm. (C and D) SG density (C) and SG average speed (D) in the TIRF plane quantified in the condition shown in B before and after 100 µM nicotine stimulation. (E) Average MSD of tracked NPY-mCherry–positive SG appearing in the TIRF plane and moving toward the plasma membrane in the conditions shown in B, after nicotine stimulation, over 12 s of tracking. (F) NPY-hPLAP release was measured as described in Materials and methods using a double-stimulation protocol in control PC12 and cells expressing GFP–sh2-RNA or GFP–sh3-RNA. Released NPY-hPLAP is expressed as a percentage of total (n = 3 independent experiments). (G) Western blot using the anti–myosin VI antibody in wild-type (wt) or myosin VI stable knockdown (myosin VI KD) PC12 cells. A black line between the two lanes indicates the removal of intervening lanes from the original image for presentation purposes. (H) Wild-type or myosin VI knockdown PC12 cells expressing NPY-mCherry were imaged by TIRF microscopy for 40 min after a single high K+ stimulation. 40 frames per time point were analyzed, and the average SG density was quantified. SG density is expressed relative to the density values before stimulation. Error bars are means ± SEM. *, P < 0.05; **, P < 0.01; ***, P < 0.001.
Figure 3.
Figure 3.
Myosin VI SI potentiates evoked exocytosis. (A) RT-PCR analysis of myosin VI isoform expression. β-Actin primers were used as a control. (B) Cartoons of GFP-tagged myosin VI constructs. The motor domain (purple) contains the actin- and ATP-binding sites, the reverse gear (761–814 aa, yellow) determines the unique directionality of myosin VI movement along actin, and the tail domain (orange) in the myosin VI SI (1,262 aa), but not the myosin VI NI (1,253 aa), contains a 9-aa insert. GFP-MyoVI-tail constructs lack the motor domain and are unable to interact with F-actin. (C) GFP-MyoVI protein expression in PC12 cells was evaluated by Western blotting using an anti–myosin VI antibody. Arrows indicate GFP-MyoVI-full proteins (175 kD) and GFP-MyoVI-tail proteins (85 kD). (D) NPY-hPLAP release was evaluated using a double-stimulation protocol in PC12 cells expressing GFP (control), GFP-MyoVI-SIfull, or GFP-MyoVI-NIfull. Released NPY-hPLAP is expressed as a percentage of total NPY-hPLAP (n = 3). (E) NPY-hPLAP release was measured in wild-type (wt) and myosin VI stable knockdown (KD) PC12 cells overexpressing GFP (control), GFP-MyoVI-SIfull (+GFP-MyoVI-SIfull), or GFP-MyoVI-NIfull (+GFP-MyoVI-NIfull). Released NPY-hPLAP is expressed as a percentage of wild-type PC12 cells (n = 3). Error bars are means ± SEM. *, P < 0.05; **, P < 0.01; ***, P < 0.001.
Figure 4.
Figure 4.
Myosin VI SI mediates the caging of SG to the cortical actin network in myosin VI knockdown cells. (A and B) Myosin VI stable knockdown (KD) PC12 cells coexpressing NPY-mCherry with GFP-MyoVI-SIfull (A) or GFP-MyoVI-NIfull (B) were imaged by TIRF microscopy before and after nicotine stimulation. Videos were acquired at a rate of one frame per second. The insets highlight the trajectories of GFP-MyoVI–positive (arrowheads) and GFP-MyoVI–negative (arrows) SGs during 12 s after stimulation. (C) Average MSD of NPY-mCherry–positive SGs tracked in untransfected myosin VI stable knockdown cells and in myosin VI stable knockdown cells expressing GFP-MyoVI-SIfull. (D) Average MSD of NPY-mCherry–positive SGs tracked in untransfected myosin VI stable knockdown cells and in myosin VI stable knockdown cells expressing GFP-MyoVI-NIfull. (E) Time-lapse series of a single NPY-mCherry–positive SG appearing in the TIRF plane and becoming highly restricted upon association with GFP-MyoVI-SIfull. The arrow points to the beginning of the trajectory of the SG. The arrowhead shows the end of this trajectory or the position of the SG at each time point. Video 1 shows the complete time series for this panel. (F) Time-lapse series of a single SG labeled with NPY-mCherry appearing in the TIRF plane and becoming GFP-MyoVI-NIfull positive with little effect on its movement. The arrow points to the beginning of the trajectory of the SG. The arrowhead shows the end of this trajectory or the position of the SG at each time point. Video 2 shows the complete time series for this panel. Bars: (A [main images], B [main images], E, and F) 5 µm; (A [insets] and B [insets]) 1 µm. Error bars are means ± SEM. ***, P < 0.001.
Figure 5.
Figure 5.
Myosin VI SI regulates SG density and mobility in the cortical region. (A) TIRF images of NPY-mCherry (pseudocolored gray) coexpressed with GFP (control) or with the different GFP-MyoVI proteins in PC12 cells. Left insets show GFP or the respective GFP-MyoVI expression. The enlarged images on the right highlight a fixed area for comparison of SG density at the plasma membrane. (B and C) SG density (B) and SG speed (C) in the TIRF plane were quantified in the conditions described in A before and after 100 µM nicotine stimulation. (D and E) MSD versus time (D) and average values (E) after 40 s of tracking of NPY-mCherry–positive SGs shown in A. (F) PC12 cells coexpressing NPY-mCherry with GFP (control), GFP-MyoVI-SIfull, or GFP-MyoVI-SItail were imaged by TIRF microscopy. NPY-mCherry–positive SGs were tracked, and their lateral movement and displacement length were analyzed. Track displacement length is displayed as a color code. Note the high proportion of short trajectories when the GFP-MyoVI-SIfull was expressed and the very long tracks were detected upon expression of GFP-MyoVI-SItail. Bars: (A [main images and left insets] and F) 5 µm; (A [right insets]) 1 µm. Error bars are means ± SEM. **, P < 0.01; ***, P < 0.001.
Figure 6.
Figure 6.
Myosin VI SI recruits SGs in an activity- and F-actin–dependent manner. (A) Bright-field, epifluorescence, and EM images of PC12 cells expressing GFP-MyoVI-SIfull processed for correlative EM. Arrows indicate dense-core SGs clustered in the region of transfected cells where the GFP-MyoVI-SIfull–positive structures are located (insets). (B and C) Live-cell confocal images of PC12 cells coexpressing NPY-mCherry with GFP-MyoVI-SIfull (B) or GFP-MyoVI-NIfull (C) before (control) and after 100 µM nicotine (nicotine) stimulation. The insets highlight the NPY-mCherry–positive SGs clustered around GFP-MyoVI–positive structures. The NPY-mCherry images are shown as pseudocolor images. A region of interest around a GFP-MyoVI–positive structure was used for quantification of NPY-mCherry fluorescence (right graphs) in the conditions described in B and C. (D and E) Quantification of NPY-mCherry fluorescence around GFP-MyoVI-SItail (D)– or GFP-MyoVI-NItail (E)–positive structures before (control, black) and after 100 µM nicotine stimulation (nicotine, red). Average NPY-mCherry fluorescence is expressed as a percentage of initial fluorescence. (F) GFP-MyoVI-SIfull and GFP-MyoVI-NIfull were expressed in wild-type (wt) or myosin VI stable knockdown (myosin VI KD) PC12 cells. After fixation, cells were imaged by confocal microscopy, and the number of cells harboring large GFP-MyoVI–positive structures (large structures) or small punctate cytosolic distribution (small puncta) were counted and expressed as a percentage of the total number of transfected cells (n = 3 independent experiments). (G, left) Confocal images of myosin VI stable knockdown PC12 cells expressing GFP-MyoVI-SIfull or GFP-MyoVI-NIfull immunolabeled with Synaptotagmin-I (red). The enlarged images show the association between expressed GFP-MyoVI and Synaptotagmin-I (Syt-I). (right) Analysis of the colocalization between Synaptotagmin-I and the different GFP-MyoVI. Bars: (B, C, and G [main images]) 5 µm; (B, C, and G [insets]) 1 µm. Error bars are means ± SEM. **, P < 0.01; ***, P < 0.001.
Figure 7.
Figure 7.
Myosin VI SI isoform is phosphorylated by c-Src kinase. (A) Alignment of the tail domain sequences of the myosin VI SI and myosin VI NI isoforms. The DYD motif comprises part of the SI (9 aa) and an adjacent aspartate (D1113) and tyrosine (Y1114) residue (red, aa 1,113–1,123). (B, top) Prediction of tyrosine phosphorylation sites in the region 1,100–1,150 aa in the myosin VI SI (left) and myosin VI NI (right) isoforms. Highlighted in red is the Y1114 residue that displays a higher phosphorylation score in myosin VI SI than in myosin VI NI (0.912 vs. 0.726). (bottom) Prediction of kinase-specific phosphorylation sites in myosin VI SI (left) and myosin VI NI (right) isoforms. Highlighted in red is the Y1114 residue predicted to be phosphorylated by c-Src protein kinase in myosin VI SI. (C) Schematic comparison between GFP-MyoVI-SIfull and GFP-MyoVI-SIfullΔDYD (see Fig. 3 for colored references) with the deleted DYD motif (aa 1,113–1,115) in red. (D) Immunoprecipitation of GFP-MyoVI from cells coexpressing GFP-MyoVI-SIfull, GFP-MyoVI-NIfull, or GFP-MyoVI-SIfullΔDYD with c-SrcY527F-GFP. (top) Western blotting using an anti–myosin VI antibody. Arrows indicate GFP-MyoVI. (middle) Phosphorylation of immunoprecipitated GFP-MyoVI detected by Western blotting using antiphosphotyrosine (pY) antibody. (bottom) c-SrcY527F-GFP expression detected by Western blotting using a specific antiphospho-Src antibody (pY416-Src, 84 kD). (E) Quantification of phosphorylated GFP-MyoVI expressed as a percentage of phosphorylated GFP-MyoVI-SIfull (n = 3). IP, immunoprecipitation; WB, Western blot. Error bars are means ± SEM. **, P < 0.01; ***, P < 0.001.
Figure 8.
Figure 8.
The function of myosin VI SI in neuroexocytosis is regulated by c-Src kinase phosphorylation. (A, left) PC12 cells coexpressing GFP-MyoVI-SIfull and NPY-mCherry pretreated with DMSO, PP3, or PP2 for 40 min at 37°C and imaged after 100 µM nicotine stimulation in the presence of DMSO (nicotine + DMSO), PP3 (nicotine + PP3), or PP2 (nicotine + PP2). (right) Quantification of NPY-mCherry fluorescence around GFP-MyoVI–positive structures in the conditions shown in the left images. The NPY-mCherry images are shown as pseudocolor images. (B, left) PC12 cells coexpressing NPY-mCherry with GFP-MyoVI-SIfull or GFP-MyoVI-SIfullΔDYD after 100 µM nicotine (nicotine) stimulation. (right) Quantification of NPY-mCherry fluorescence around GFP-MyoVI–positive structures under conditions described on the left. (C) GFP-MyoVI-SIfull and GFP-MyoVI-SIfullΔDYD expression in PC12 cells were evaluated by Western blotting using the anti–myosin VI antibody. The arrow indicates the GFP-MyoVI proteins (175 kD). (D) PC12 cells coexpressing NPY-mCherry with GFP (control), GFP-MyoVI-SIfull, or GFP-MyoVI-SIfullΔDYD were imaged by TIRF microscopy. NPY-mCherry–positive SGs were tracked after stimulation, and the average MSD during the first 40 s was plotted. (E) Average MSD at 40 s of tracking of NPY-mCherry–positive SGs. The results for control and GFP-MyoVI-SIfull–expressing cells are the same as those shown in Fig. 5 (D and E). (F) NPY-hPLAP release was evaluated using a double-stimulation protocol in PC12 cells expressing GFP (control), GFP-MyoVI-SIfull, or GFP-MyoVI-SIfullΔDYD. Released NPY-hPLAP is expressed as a percentage of total NPY-hPLAP (n = 3). The results for control and GFP-MyoVI-SIfull–expressing cells are the same as those shown in Fig. 3 D. (G) NPY-hPLAP release was measured in wild-type (wt) PC12 cells and myosin VI stable knockdown (KD) PC12 cells expressing GFP (control) or GFP-MyoVI-SIfullΔDYD (+GFP-MyoVI-SIfullΔDYD). Released NPY-hPLAP is expressed as a percentage of rescue compared with wild-type PC12 cells (n = 3). Bars: (A and B, left) 5 µm; (A and B, right) 1 µm. Error bars are means ± SEM. *, P < 0.05; **, P < 0.01; ***, P < 0.001.

References

    1. Ali M.Y., Kennedy G.G., Safer D., Trybus K.M., Sweeney H.L., Warshaw D.M. 2011. Myosin Va and myosin VI coordinate their steps while engaged in an in vitro tug of war during cargo transport. Proc. Natl. Acad. Sci. USA. 108:E535–E541 10.1073/pnas.1104298108 - DOI - PMC - PubMed
    1. Aschenbrenner L., Lee T., Hasson T. 2003. Myo6 facilitates the translocation of endocytic vesicles from cell peripheries. Mol. Biol. Cell. 14:2728–2743 10.1091/mbc.E02-11-0767 - DOI - PMC - PubMed
    1. Au J.S., Puri C., Ihrke G., Kendrick-Jones J., Buss F. 2007. Myosin VI is required for sorting of AP-1B–dependent cargo to the basolateral domain in polarized MDCK cells. J. Cell Biol. 177:103–114 10.1083/jcb.200608126 - DOI - PMC - PubMed
    1. Bader M.F., Holz R.W., Kumakura K., Vitale N. 2002. Exocytosis: the chromaffin cell as a model system. Ann. NY Acad. Sci. 971:178–183 10.1111/j.1749-6632.2002.tb04461.x - DOI - PubMed
    1. Bain J., McLauchlan H., Elliott M., Cohen P. 2003. The specificities of protein kinase inhibitors: an update. Biochem. J. 371:199–204 10.1042/BJ20021535 - DOI - PMC - PubMed

Publication types

MeSH terms