. 2013 Feb 11;210(2):257-68.
doi: 10.1084/jem.20121525. Epub 2013 Feb 4.

Signaling through C5a receptor and C3a receptor diminishes function of murine natural regulatory T cells

Affiliations

Signaling through C5a receptor and C3a receptor diminishes function of murine natural regulatory T cells

Wing-hong Kwan et al. J Exp Med. .

Abstract

Thymus-derived (natural) CD4(+) FoxP3(+) regulatory T cells (nT reg cells) are required for immune homeostasis and self-tolerance, but must be stringently controlled to permit expansion of protective immunity. Previous findings linking signals transmitted through T cell-expressed C5a receptor (C5aR) and C3a receptor (C3aR) to activation, differentiation, and expansion of conventional CD4(+)CD25(-) T cells (T conv cells), raised the possibility that C3aR/C5aR signaling on nT reg cells could physiologically modulate nT reg cell function and thereby further impact the induced strength of T cell immune responses. In this study, we demonstrate that nT reg cells express C3aR and C5aR, and that signaling through these receptors inhibits nT reg cell function. Genetic and pharmacological blockade of C3aR/C5aR signal transduction in nT reg cells augments in vitro and in vivo suppression, abrogates autoimmune colitis, and prolongs allogeneic skin graft survival. Mechanisms involve C3a/C5a-induced phosphorylation of AKT and, as a consequence, phosphorylation of the transcription factor Foxo1, which results in lowered nT reg cell Foxp3 expression. The documentation that C3a/C3aR and C5a/C5aR modulate nT reg cell function via controlling Foxp3 expression suggests targeting this pathway could be exploited to manipulate pathogenic or protective T cell responses.


Figures

Figure 1.
Figure 1.
C3aR and C5aR govern in vitro nT reg cell function. (A) Kinetics of C3aR and C5aR gene expression in anti-CD3/anti-CD28–stimulated, flow-sorted CD4+GFP-Foxp3+ nT reg cells. *, P < 0.05 versus time 0. (B) C5aR expression (black unfilled) on resting WT nT reg cells (left), 24 h anti-CD3/CD28-stimulated (1 µg/ml) nT reg cells (middle), and Ly6G+ neutrophils (right). Staining of C5ar1−/− cells (gray filled) was identical to isotype controls (not depicted). (C) Representative overlays showing in vitro suppression of CFSE-labeled CD45.1+CD4+CD25 T conv cells mixed with no nT reg cells (gray), CD45.2+ WT nT reg cells (blue) or CD45.2+ C3ar1−/−C5ar1−/− nT reg cells (red) at the ratios indicated. Each histogram is gated on CD45.1+ T conv cells cells. (D) Division indices (mean number of divisions for all of the cells in the original starting population) indicating suppressive capacity of WT (blue) versus C3ar1−/−C5ar1−/− (red) nT reg cells in 72 h suppression assays. (E) Analogous assays performed for WT versus C3ar1−/− (left) or C5ar1−/− (right) nT reg cells. Assays are representative of at least three individual experiments. (F) Division indices of WT nT reg cells from 72-h suppression assays containing C3ar1−/−C5ar1−/− T conv cells and buffer control (black) or C3aR-A + C5aR-A (red). P < 0.05 vs. control. (G) CFSE dilution plots gated on CD45.2+ C3ar1−/−C5ar1−/− T conv cells with (blue) or without (red) WT CD45.1+ nT reg cells at a 1:1 ratio in the presence of either WT (top) or Daf1−/− (bottom) DCs. (H) Total number CD45.2+ C3ar1−/−C5ar1−/− T conv cells/well (72-h suppression assays) containing WT nT reg cells, WT, or Daf1−/− APCs ± C3aR-A/C5aR-A. *, P < 0.05. Each experiment was repeated at least three times with similar results.
Figure 2.
Figure 2.
C3aR/C5aR signaling regulates Foxp3 expression. (A) Representative flow plots of intracellular Foxp3 in resting WT (blue) and C3ar1−/−C5ar1−/− (red) Foxp3-GFP+ nT reg cells. (B) Quantification of MFI from panel A in each subset. *, P < 0.05. (C) Quantified Foxp3 mean fluorescence index in nT reg cells obtained from in vitro suppression assays at 72 h, expressed as a fold increase over simultaneously studied WT controls (considered 100%). Mean C3aR-A/C5aR-A = 131%; mean C3aR−/−C5aR−/− = 126%; n = 7 experiments/group; *, P < 0.05 vs. untreated WT. Representative histograms (D) and quantified MFI (E) pooled from three experiments for cell surface–expressed CTLA4 on WT and C3ar1−/−C5ar1−/− Foxp3-GFP nT reg cells (gated on GFP+ cells) 24 h after stimulation with anti-CD3. *, P < 0.05. (F and G) MFI for Foxp3-GFP expression in WT nT reg cells (F) or C3ar1−/−C5ar1−/− nT reg cells (G) 72 h after stimulation with 1 µg/ml anti-CD3 ± C3a/C5a. Each individual experiment was repeated at least once with similar results. *, P < 0.05.
Figure 3.
Figure 3.
C3aR/C5aR-induced Foxp3 down-regulation results in diminished suppressive capacity. Representative overlay histograms for flow-sorted Foxp3-GFP+ cells obtained from WT (blue) or C3ar1−/−C5ar1−/− (red) mice before stimulation (A) or after a 5-d in vitro stimulation with anti-CD3, IL-2 and Daf1−/− DCs (B). (C-D) Results of ELISAs (triplicate wells) performed on 5 d culture supernatants for TGFβ (C) and IL-10 (D). (E) Representative quantification (left) and 4:1 T conv cells/nT reg cells histogram (right) of suppression assays using nT reg cells obtained from B. (F and G) Re-sorted Foxp3-GFPhi WT and C3ar1−/−C5ar1−/− nT reg cells after 3 d in culture with anti-CD3, IL-2, and Daf1−/− DCs were used in suppression assays. Foxp3-GFP expression on re-sorted cells (F) and suppressive capacity (G) did not differ between groups. Histogram inset shows representative CSFE dilution without nT reg cells (black), with WT nT reg cells (blue), or C3ar1−/−C5ar1−/− nT reg cells (red) at 4:1 T conv cells/nT reg cells. The data are representative of 3–4 independent experiments for each panel. *, P < 0.05.
Figure 4.
Figure 4.
C3aR/C5aR signaling regulates stability of Foxp3 expression in response to a proinflammatory stimulus in vitro. (A) Representative flow plot of Foxp3 and CD25 expression levels and gating strategy to define CD25hi versus CD25lo subsets. (B) Percentages of CD4+Foxp3-GFP+CD25hi cells in spleen (closed circles) and peripheral lymph nodes (open circles) of naive WT and C3ar1−/−C5ar1−/− mice. (C) Representative histograms of Foxp3 expression in CD25hi (top) and CD25lo (bottom) WT (blue) and C3ar1−/−C5ar1−/−(red) nT reg cells 5 d after stimulation with IL-2 alone (left) or anti-CD3/CD28, IL-2/IL-6 (right). (D) Quantified results from CD25hi (left) and CD25lo (right) T reg cells (n = 3). WT (closed circles) and C3ar1−/−C5ar1−/− (open circles) are shown. *, P < 0.05. (E) MFI for Foxp3-GFP within the remaining Foxp3+ cells of the CD25 hi WT and C3ar1−/−C5ar1−/− after 5 d in IL-2 or anti-CD3/CD28, IL-2/IL-6. WT (closed circles) and C3ar1−/−C5ar1−/− (open circles) are shown. *, P < 0.05. All experiments were performed at least three times with similar results.
Figure 5.
Figure 5.
AKT and Foxo1 link C3aR/C5aR signaling to Foxp3 expression. (A and B) Representative immunoblots of flow-sorted Foxp3-GFP+ CD4+ nT reg cells lysates 15 min after stimulation with C3a, C5a, both, or control (buffer alone). p-AKT/total AKT (A) and p-Foxo1/total Foxo1 (B) shown with quantification normalized to nonphosphorylated bands (bottom of each panel). (C) Representative immunoblot of flow-sorted Foxp3-GFP+CD4+ nT reg cells lysates 15 min after stimulation with C3a+C5a ± PI-3K inhibitor LY294 for p-AKT, total AKT, p-Foxo1, and total Foxo1. No signal above background was detected for p-AKT or p-Foxo1 in lysates from the LY294-treated cells. Blots are representative of at least independent three experiments. (D) Total number of T conv cells from suppression cultures using WT, Foxo1−/−, or C3ar1−/−C5ar1−/− nT reg cells + C3aR-A/C5aR-A (white) or buffer control (black). *, P < 0.05. The experiment was repeated twice with similar results.
Figure 6.
Figure 6.
C3aR−/−C5aR−/− nT reg cells exhibit enhanced ability to inhibit homeostatic proliferation. CD45.1 T conv cells were injected alone or 1:1 with CD45.2+ WT or with C3ar1−/−C5ar1−/− nT reg cells into syngeneic rag1−/− recipients. Homeostatic proliferation was assessed on day 6. (A) Total number of splenic T conv cells per mouse after co-transfer with no nT reg cells or WT nT reg cells. (B) In a separate experiment, WT and C3ar1−/−C5ar1−/− nT reg cells suppress homeostatic proliferation. Representative flow plots from two individual experiments depicting percentages of nT reg cells per spleen(C) and the total number of nT reg cells per spleen (D). *, P < 0.05.
Figure 7.
Figure 7.
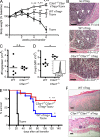
C3aR−/−C5aR−/− nT reg cells more efficiently prevent autoimmune colitis and skin allograft rejection in vivo. Autoimmune colitis was assessed over 6 wk. (A) Weights of animals given CD45.1 T conv cells alone (closed circles, n = 3), T conv cells plus 2:1 CD45.2+ WT nT reg cells (open squares, n = 10), or T conv cells plus 2:1 C3ar1−/−C5ar1−/− nT reg cells (open triangles, n = 10). Data are pooled from two individual experiments. (B) Representative H&E-stained colon sections with quantitative scores (n = 5–6 per group) shown in bottom right. Bar, 100 µm. *, P < 0.05 versus no nT reg cells; **, P < 0.05 versus WT nT reg cells. (C) Number of CD45.2+ nT reg cells per spleen of each mouse from A at 6 wk. (D) Representative Foxp3 staining gated on splenic CD45.2 nT reg cells at 6 wk from each mouse in A. Representative Foxp3 expression histogram shown in bottom inset. WT, filled; C3ar1−/−C5ar1−/−, open. *, P < 0.05. (E) BALB/c tail skin graft survival in B6 rag1−/− recipients receiving T conv cells alone (black, n = 3), T conv cells + WT nT reg cells (blue, n = 12), or T conv cells + C3ar1−/−C5ar1−/− nT reg cells (red, n = 12). *, P < 0.05 versus no T reg cells; **, P = 0.05 versus WT nT reg cells. (F) Representative skin grafts in recipients receiving WT nT reg cells sacrificed at day 65 rejection (left) or C3ar1−/−C5ar1−/− nT reg cells sacrificed at day 120 were H&E stained. Bar, 100 µM.

References

    1. André S., Tough D.F., Lacroix-Desmazes S., Kaveri S.V., Bayry J. 2009. Surveillance of antigen-presenting cells by CD4+ CD25+ regulatory T cells in autoimmunity: immunopathogenesis and therapeutic implications. Am. J. Pathol. 174:1575–1587 10.2353/ajpath.2009.080987 - DOI - PMC - PubMed
    1. Bettini M., Vignali D.A. 2009. Regulatory T cells and inhibitory cytokines in autoimmunity. Curr. Opin. Immunol. 21:612–618 10.1016/j.coi.2009.09.011 - DOI - PMC - PubMed
    1. Brunet A., Kanai F., Stehn J., Xu J., Sarbassova D., Frangioni J.V., Dalal S.N., DeCaprio J.A., Greenberg M.E., Yaffe M.B. 2002. 14-3-3 transits to the nucleus and participates in dynamic nucleocytoplasmic transport. J. Cell Biol. 156:817–828 10.1083/jcb.200112059 - DOI - PMC - PubMed
    1. Carnero A., Blanco-Aparicio C., Renner O., Link W., Leal J.F. 2008. The PTEN/PI3K/AKT signalling pathway in cancer, therapeutic implications. Curr. Cancer Drug Targets. 8:187–198 10.2174/156800908784293659 - DOI - PubMed
    1. Chen L., Ahmed E., Wang T., Wang Y., Ochando J., Chong A.S., Alegre M.L. 2009. TLR signals promote IL-6/IL-17-dependent transplant rejection. J. Immunol. 182:6217–6225 10.4049/jimmunol.0803842 - DOI - PMC - PubMed

Publication types

MeSH terms