

Ribosome traffic on mRNAs maps to gene ontology: genome-wide quantification of translation initiation rates and polysome size regulation
- PMID: 23382661
- PMCID: PMC3561044
- DOI: 10.1371/journal.pcbi.1002866
Ribosome traffic on mRNAs maps to gene ontology: genome-wide quantification of translation initiation rates and polysome size regulation
Abstract
To understand the complex relationship governing transcript abundance and the level of the encoded protein, we integrate genome-wide experimental data of ribosomal density on mRNAs with a novel stochastic model describing ribosome traffic dynamics during translation elongation. This analysis reveals that codon arrangement, rather than simply codon bias, has a key role in determining translational efficiency. It also reveals that translation output is governed both by initiation efficiency and elongation dynamics. By integrating genome-wide experimental data sets with simulation of ribosome traffic on all Saccharomyces cerevisiae ORFs, mRNA-specific translation initiation rates are for the first time estimated across the entire transcriptome. Our analysis identifies different classes of mRNAs characterised by their initiation rates, their ribosome traffic dynamics, and by their response to ribosome availability. Strikingly, this classification based on translational dynamics maps onto key gene ontological classifications, revealing evolutionary optimisation of translation responses to be strongly influenced by gene function.
Conflict of interest statement
The authors have declared that no competing interests exist.
Figures
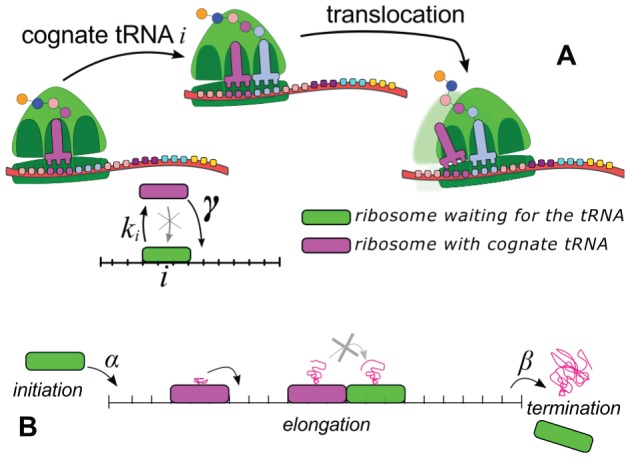
 capture the cognate tRNA with a rate
  , then keep it and advance with a rate
  , provided that the following codon is empty. (B) The entire translation process can be viewed as particles moving on a lattice. Ribosomes attempt to initiate the translation with a rate
  . Then they move according to the dynamical rules introduced above and at the end of the lattice the ribosomes detach with a termination rate
  . Particles can queue if the bottlenecks in the lattice cannot support the incoming flow.
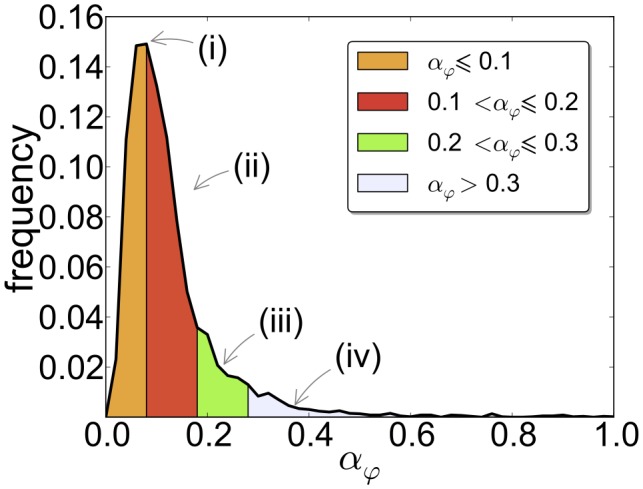
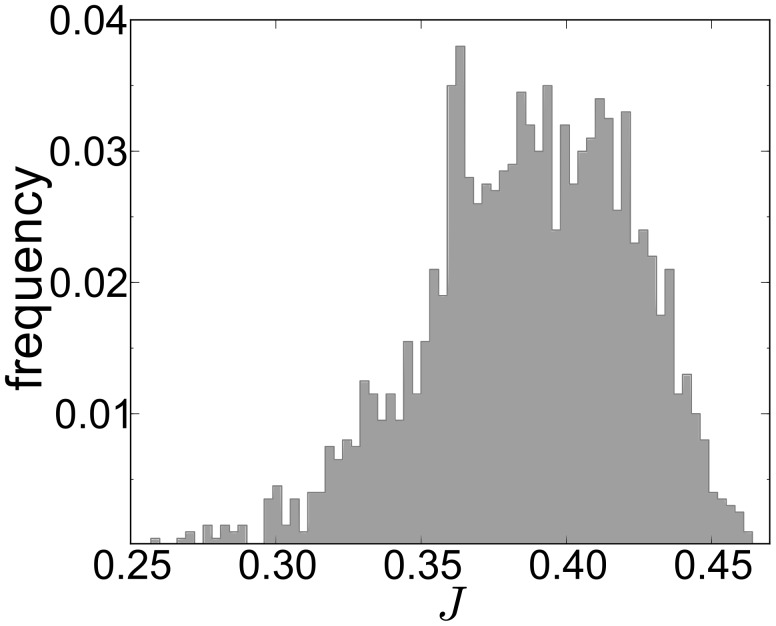
 and the median is
  . Most of the mRNAs have an estimated initiation rate
  and therefore we show only this range.
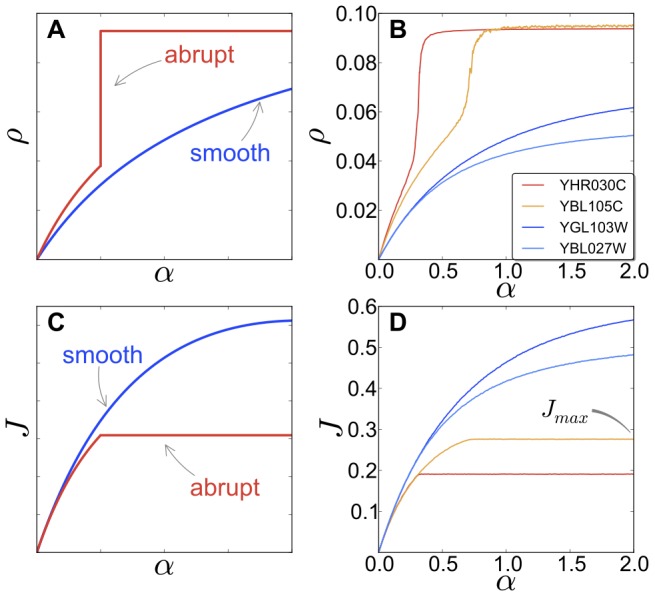
 and the current
  , respectively. The genes are divided in two categories, according to the shape of
  , as shown in (A): abrupt mRNAs (red, colour online) present a steep increase of the polysome size with increasing the initiation rate. On the other and, smooth sequences (blue, colour online) do not show this feature. The current (C) is also affected, with abrupt genes exhibiting a sudden change, or ‘kink’ in the current, while the current of smooth mRNAs does not suddenly saturate. Panels (B) and (D) show the outcome of numerical simulations of real sequences from S. cerevisiae. Genes YGL103W and YBL027W are ribosomal proteins while YHR030C and YBL105C are kinase regulatory proteins.
  indicates the saturation value of the current (see text).
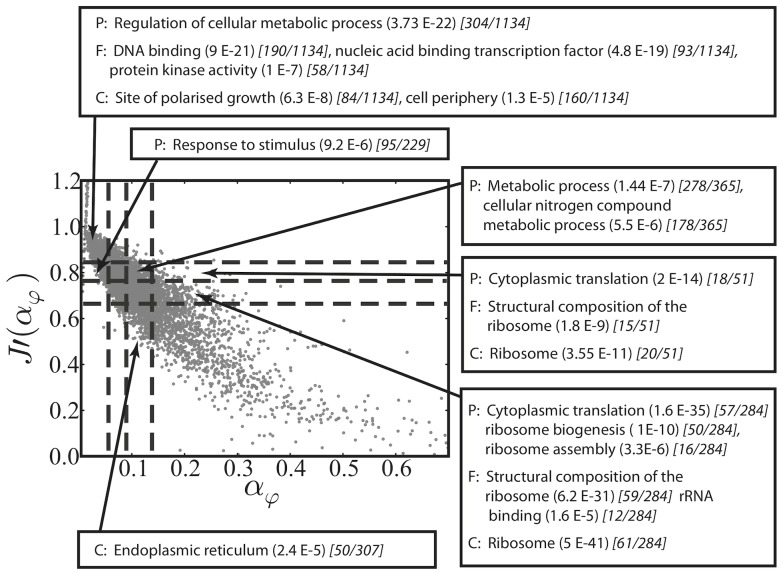
 .
.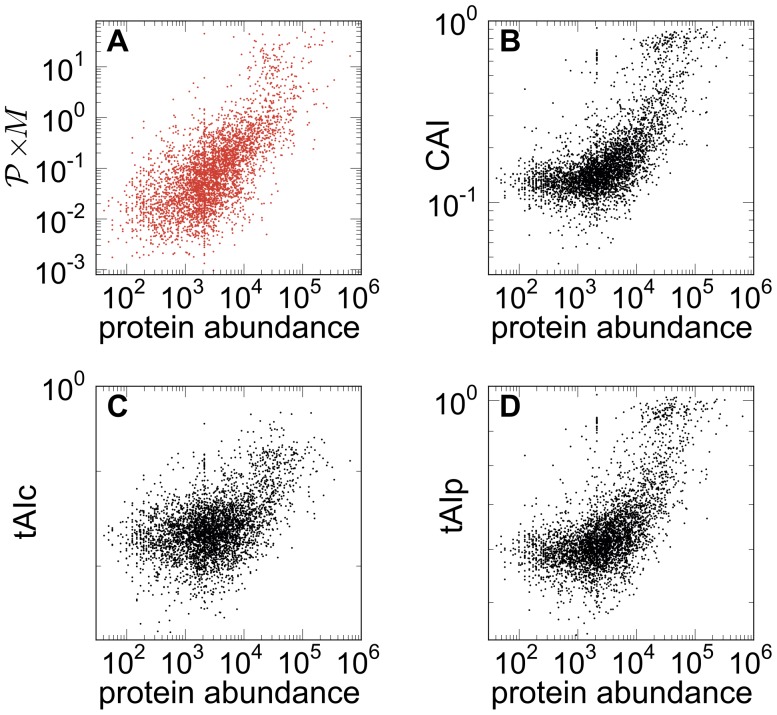
 versus abundance of proteins. The mRNA abundances are from and the experimentally measured protein levels from . The plot shows a clear correlation between the model prediction of the amount of proteins in the cell and the experimental values. (B) CAI from versus protein abundance. (C) and (D) show different variants of the tRNA adaptation index, tAIc and tAIp from , vs protein abundance. Our approach yields a better correlation between the predicted and measured protein abundance.
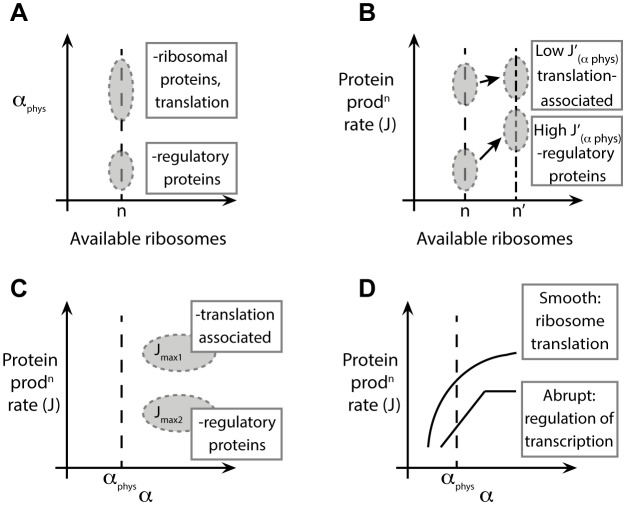
 we found mRNA-specific initiation rates, distributed over a broad range of values (Figure 2). Different regions of the distributions can be mapped to certain GO annotations. For example, mRNAs with small physiological initiation rate
  are regulatory proteins while genes involved in translation have a larger initiation rate. (B) Changes in initiation (induced, for instance, by variations in the ribosomal pool, e.g. available ribosomes increase to a value of
  ) are estimated by our modelling and theoretically perceived by the transcript in different ways, according to their current-initiation relationship
  . In particular, some mRNAs have a large gearing factor
  , such as regulatory proteins, while other messengers, such as translation associated ones, are less sensitive to changes of the initiation rate. (C) For very large initiation rates the protein production rates reach a maximal elongation-limited value, i.e. only depending on the sequence of codons. We discover that translation associated genes have a larger maximal production rate when compared to other mRNAs, such as regulatory proteins, whose production might need to be capped. (D) In general we find two main groups of sequences classified according to their current-initiation relationship
  . Abrupt sequences, usually regulatory proteins, present an abrupt ‘kink’ in
  , meaning that the protein production rate can quickly saturate above specific values (sequence-dependent) of the initiation rate. Genes involved in translation like ribosomal proteins are instead classified as smooth sequences, since their sequences are such that this abrupt crossover does not exist.
References
-
- Shalon D, Smith SJ, Brown PO (1996) A DNA microarray system for analyzing complex DNA samples using two-color uorescent probe hybridization. Genome Research 6: 639–645. - PubMed
-
- Ideker T, Thorsson V, Ranish JA, Christmas R, Buhler J, et al. (2001) Integrated genomic and proteomic analyses of a systematically perturbed metabolic network. Science 292: 929–934. - PubMed
-
- Schwanhausser B, Busse D, Li N, Dittmar G, Schuchhardt J, et al. (2011) Global quantification of mammalian gene expression control. Nature 473: 337–342. - PubMed
Publication types
MeSH terms
Substances
Grants and funding
LinkOut - more resources
Full Text Sources
Other Literature Sources
Molecular Biology Databases
