. 2013;9(1):e1002893.
doi: 10.1371/journal.pcbi.1002893. Epub 2013 Jan 31.

Bayesian inference of spatial organizations of chromosomes

Affiliations

Bayesian inference of spatial organizations of chromosomes

Ming Hu et al. PLoS Comput Biol. 2013.

Abstract

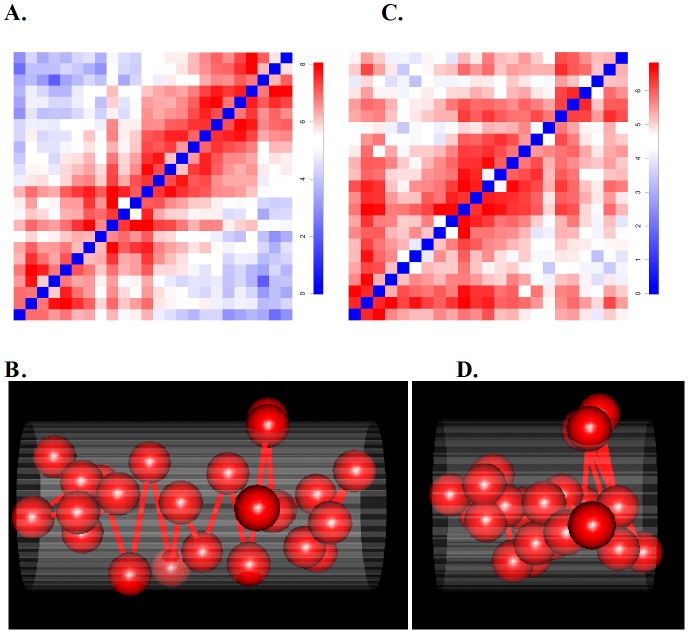
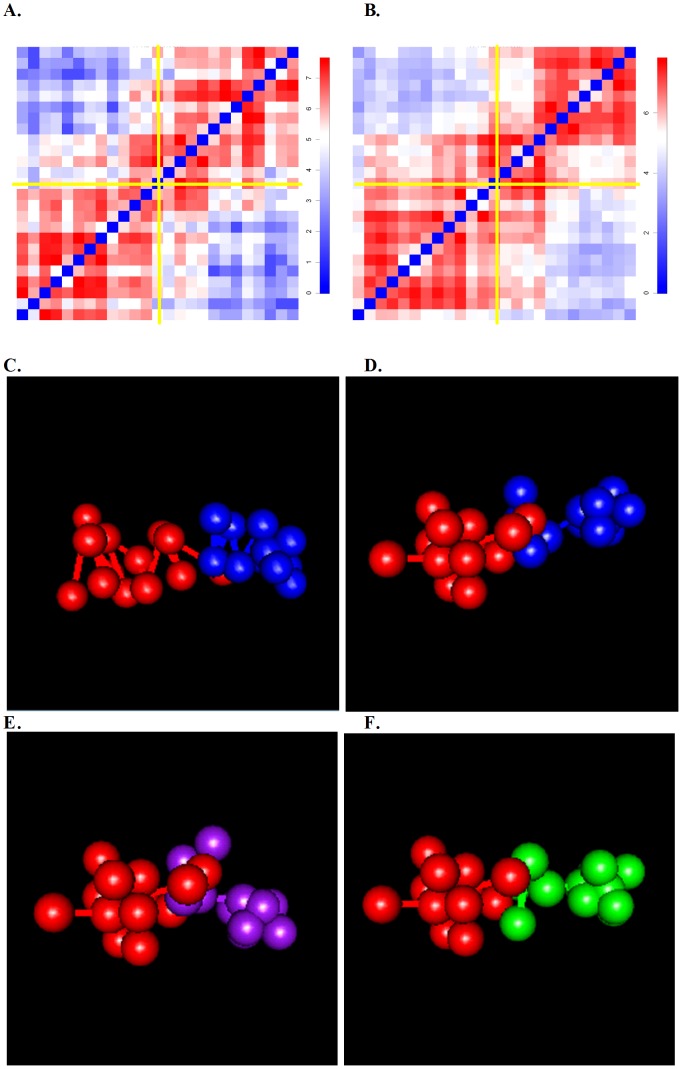
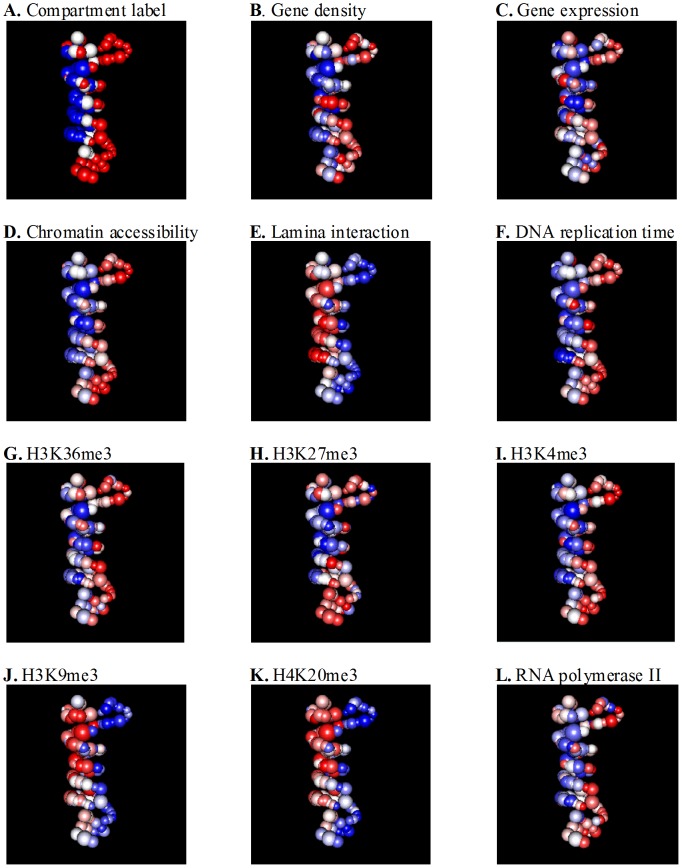
Knowledge of spatial chromosomal organizations is critical for the study of transcriptional regulation and other nuclear processes in the cell. Recently, chromosome conformation capture (3C) based technologies, such as Hi-C and TCC, have been developed to provide a genome-wide, three-dimensional (3D) view of chromatin organization. Appropriate methods for analyzing these data and fully characterizing the 3D chromosomal structure and its structural variations are still under development. Here we describe a novel Bayesian probabilistic approach, denoted as "Bayesian 3D constructor for Hi-C data" (BACH), to infer the consensus 3D chromosomal structure. In addition, we describe a variant algorithm BACH-MIX to study the structural variations of chromatin in a cell population. Applying BACH and BACH-MIX to a high resolution Hi-C dataset generated from mouse embryonic stem cells, we found that most local genomic regions exhibit homogeneous 3D chromosomal structures. We further constructed a model for the spatial arrangement of chromatin, which reveals structural properties associated with euchromatic and heterochromatic regions in the genome. We observed strong associations between structural properties and several genomic and epigenetic features of the chromosome. Using BACH-MIX, we further found that the structural variations of chromatin are correlated with these genomic and epigenetic features. Our results demonstrate that BACH and BACH-MIX have the potential to provide new insights into the chromosomal architecture of mammalian cells.


Conflict of interest statement

The authors have declared that no competing interests exist.

Figures

Figure 1
Figure 1. Two illustrative examples of 3D models for two topological domains using BACH.
Two illustrative examples in the HindIII sample: one for a more elongated 1 MB domain (chromosome 18, 33,960,000∼34,960,000) belonging to compartment A, the other for a less elongated 1 MB domain (chromosome 7, 62,040,000∼63,040,000) belonging to compartment B. In Figure 1B and Figure 1D, each sphere represents a 40 KB genomic region. All spheres are of equal size. In Figure 1B and Figure 1D, the x axis is the direction of the first principle component. The diameters of two fitted cylinders (grey) are set to be one. The height of the fitted cylinder in Figure 1B is 1.89 times larger than that in Figure 1D. The rank in descending order among the selected 1,199 domains was used to measure the relative magnitudes of genomic and epigenetic features (Table S2). The more elongated 1 MB domain has a high gene density, high gene expression, high H3K36me3, high H3K4me3, high RNA polymerase II, high chromatin accessibility, early DNA replication time, low H3K9me3, low H4K20me3 and low genome-nuclear lamina interaction. The 3D chromosomal structure BACH predicted for this domain (Figure 1B) has a high HD ratio (HD ratio = 2.16, rank = 146). The less elongated 1 MB domain has a low gene density, low gene expression, low H3K36me3, low H3K4me3, low RNA polymerase II, low chromatin accessibility, late DNA replication time, high H3K9me3, high H4K20me3 and high genome-nuclear lamina interaction. The 3D chromosomal structure BACH predicted for this domain (Figure 1D) has a low HD ratio (HD ratio = 1.14, rank = 842). The more elongated 1 MB domain has median H3K27me3 signal, while the less elongated 1 MB domain has low H3K27me3 signal. These results can be partially explained by the weak correlation between the HD ratio and H3K27me3 (Table S1, Pearson correlation coefficients = 0.14, p-value = 4.9e-7). They are also consistent with the results in the human Hi-C study demonstrating weak enrichment of H3K27me3 in compartment A . (A) 40 KB resolution Hi-C contact matrix of a more elongated domain belonging to compartment A. The color scheme is proportional to Log2 read counts. (B) The 3D chromosomal structure BACH predicted for the domain described in Figure 1A. HD ratio = 2.16. (C) 40 KB resolution Hi-C contact matrix of a less elongated domain belonging to compartment B. The color scheme is proportional to Log2 read counts. (D) The 3D chromosomal structure BACH predicted for the domain described in Figure 1C. HD ratio = 1.14.
Figure 2
Figure 2. Domain center regions exhibit lower structural variations than domain boundary regions.
Two illustrative examples in the HindIII sample: one for the domain center region (Chromosome 2, 117,580,000∼118,580,000) with low structural variations, and the other for the domain boundary region (Chromosome 1, 135,540,000∼136,540,000) with high structural variations. In Figure 2C∼Figure 2F, each sphere represents a 40 KB genomic region. All spheres are of equal size. (A) 40 KB resolution Hi-C contact map of a 1 MB domain center region in the HindIII sample. The color scheme is proportional to Log2 read counts. Two yellow lines divide the Hi-C contact map of a 1 MB region into two 500 KB adjacent sub-regions. (B) 40 KB resolution Hi-C contact map of a 1 MB domain boundary region in the HindIII sample. The color scheme is proportional to Log2 read counts. Two yellow lines divide the Hi-C contact map of a 1 MB region into two 500 KB adjacent sub-regions. (C) The effective structure BACH-MIX predicted (proportion = 0.99) for the domain center region. Red spheres and lines represent the bottom left region in Figure 2A, blue spheres and lines represent the top right region in Figure 2A. (D) The first effective structure BACH-MIX predicted (proportion = 0.77) for the domain boundary region. Red spheres and lines represent the bottom left region in Figure 2B, blue spheres and lines represent the top right region in Figure 2B. (E) The second effective structure BACH-MIX predicted (proportion = 0.14) for the domain boundary region. Red spheres and lines represent the bottom left region in Figure 2B, purple spheres and lines represent the top right region in Figure 2B. (F) The third effective structure BACH-MIX predicted (proportion = 0.08) for the domain boundary region. Red spheres and lines represent the bottom left region in Figure 2B, green spheres and lines represent the top right region in Figure 2B.
Figure 3
Figure 3. Spatial organization of genomic and epigenetic features.
We used the 3D chromosomal structure BACH predicted for chromosome 2 in the HindIII sample as an illustrative example. In Figure 3A∼Figure 3L, each sphere represent a topological domain. The volume of each sphere is proportional to the genomic size of the corresponding topological domain. In Figure 3A, the red, white and blue colors represent topological domains belonging to compartment A, straddle region and compartment B, respectively. Topological domains with the same compartment label tend to locate on the same side of the structure. In Figure 3B∼Figure 3L, the red, white and blue colors represent topological domains with high value of features, median value of features and low value of features, respectively. The color scheme is proportional to the magnitude of the continuous measurement of genetic and epigenetic features. We also report the odds ratio (OR) of the two by two contingency table and the p-value of Fisher's exact test. (A) Spatial organization of compartment label. OR = 39.20, p-value = 4.4e-16. (B) Spatial organization of gene density. OR = 13.21, p-value = 2.2e-8. (C) Spatial organization of gene expression. OR = 4.00, p-value = 0.0012. (D) Spatial organization of chromatin accessibility. OR = 26.88, p-value = 5.9e-12. (E) Spatial organization of genome-nuclear lamina interaction. OR = 40.00, p-value = 4.9e-13. (F) Spatial organization of DNA replication time. OR = 32.00, p-value = 1.1e-10. (G) Spatial organization of H3K36me3. OR = 10.91, p-value = 1.0e-7. (H) Spatial organization of H3K27me3. OR = 2.17, p-value = 0.0706. (I) Spatial organization of H3K4me3. OR = 24.43, p-value = 2.1e-11. (J) Spatial organization of H3K9me3. OR = 15.71, p-value = 6.7e-8. (K) Spatial organization of H4K20me3. OR = 45.10, p-value = 1.0e-13. (L) Spatial organization of RNA polymerase II. OR = 5.47, p-value = 0.0001.

References

    1. Dekker J (2008) Gene regulation in the third dimension. Science 319: 1793–1794. - PMC - PubMed
    1. Fraser P, Bickmore W (2007) Nuclear organization of the genome and the potential for gene regulation. Nature 447: 413–417. - PubMed
    1. Miele A, Dekker J (2008) Long-range chromosomal interactions and gene regulation. Mol Biosyst 4: 1046–1057. - PMC - PubMed
    1. Misteli T (2007) Beyond the sequence: cellular organization of genome function. Cell 128: 787–800. - PubMed
    1. Misteli T (2004) Spatial positioning; a new dimension in genome function. Cell 119: 153–156. - PubMed

Publication types