. 2013;9(1):e1002894.
doi: 10.1371/journal.pcbi.1002894. Epub 2013 Jan 31.

Starling flock networks manage uncertainty in consensus at low cost

Affiliations

Starling flock networks manage uncertainty in consensus at low cost

George F Young et al. PLoS Comput Biol. 2013.

Abstract

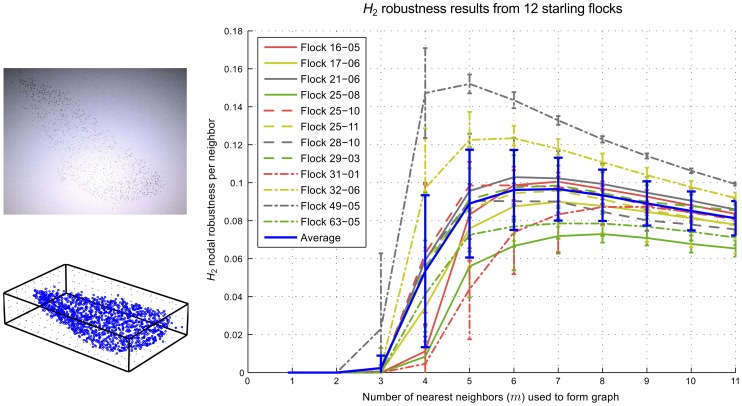
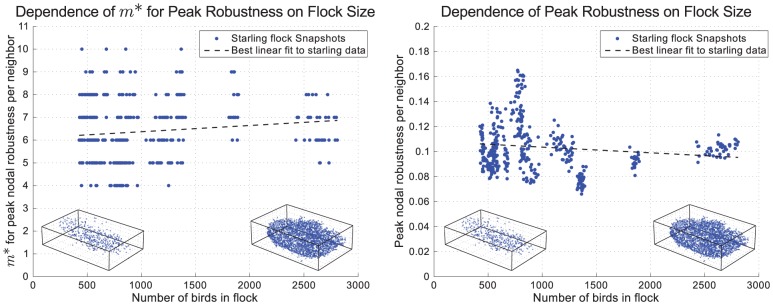
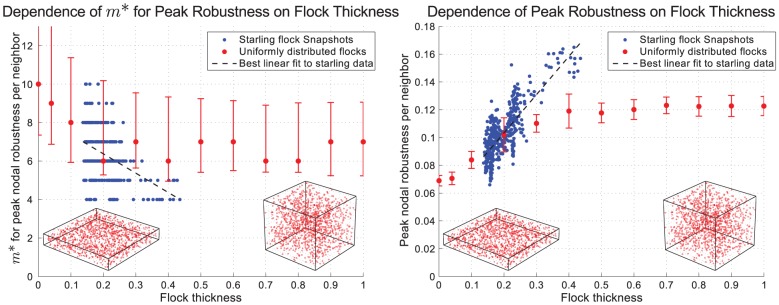
Flocks of starlings exhibit a remarkable ability to maintain cohesion as a group in highly uncertain environments and with limited, noisy information. Recent work demonstrated that individual starlings within large flocks respond to a fixed number of nearest neighbors, but until now it was not understood why this number is seven. We analyze robustness to uncertainty of consensus in empirical data from multiple starling flocks and show that the flock interaction networks with six or seven neighbors optimize the trade-off between group cohesion and individual effort. We can distinguish these numbers of neighbors from fewer or greater numbers using our systems-theoretic approach to measuring robustness of interaction networks as a function of the network structure, i.e., who is sensing whom. The metric quantifies the disagreement within the network due to disturbances and noise during consensus behavior and can be evaluated over a parameterized family of hypothesized sensing strategies (here the parameter is number of neighbors). We use this approach to further show that for the range of flocks studied the optimal number of neighbors does not depend on the number of birds within a flock; rather, it depends on the shape, notably the thickness, of the flock. The results suggest that robustness to uncertainty may have been a factor in the evolution of flocking for starlings. More generally, our results elucidate the role of the interaction network on uncertainty management in collective behavior, and motivate the application of our approach to other biological networks.


Conflict of interest statement

The authors have declared that no competing interests exist.

Figures

Figure 1
Figure 1. nodal robustness per neighbor as a function of the number of nearest neighbors (m) used to form the graph, for twelve separate flocks as well as an overall average.
For each flock the curve shown is the average of all snapshots taken of that flock, with error bars showing the standard deviation. The overall average, shown as the blue curve, is an average of the twelve flocks, with error bars showing the standard deviation. If, instead, an average is taken of every snapshot (394 in total), the resulting curve and standard deviations are almost identical (see Fig. S2), although the error is greatly reduced (see Fig. S3). On the left is shown a snapshot of starling flock 25-08 in flight and the corresponding tracked positions, rotated to fit inside a rectangular bounding box.
Figure 2
Figure 2. Dependence of the optimum number of neighbors (m*) and the peak value of robustness per neighbor on the number of birds in the flock (N).
Different snapshots from the same flock have different numbers of birds due to occlusions. Results for each snapshot are shown rather than averaged across flocks since we can take each snapshot to be an independent observation (see Fig. S2). Under each plot are the bird positions (rotated to fit inside a rectangular bounding box) for two snapshots corresponding to the smallest and largest flocks studied.
Figure 3
Figure 3. Dependence of the optimum number of neighbors (m*) and the peak value of robustness per neighbor on the thickness of the flock.
Flock thickness is defined as the ratio of smallest to largest dimension of an ellipsoid having the same principal moments of inertia as the flock. Results are shown in blue from each snapshot of starling data and in red from flocks randomly generated from a uniform distribution within a rectangular prism. Each data point shown from the random flocks is the average result from generating 100 separate flocks, each containing 1200 individuals. The error bars shown for peak values are the standard deviation, while the error bars for m* show the range of values for which the robustness per neighbor is within 90% of the peak. Under each plot are the positions of two randomly generated flocks, with thicknesses of 0.15 and 0.85.

References

    1. Ballerini M, Cabibbo N, Candelier R, Cavagna A, Cisbani E, et al. (2008) Interaction ruling animal collective behavior depends on topological rather than metric distance: Evidence from a field study. Proc Natl Acad Sci U S A 105: 1232–1237. - PMC - PubMed
    1. Bialek W, Cavagna A, Giardina I, Mora T, Silvestri E, et al. (2012) Statistical mechanics for natural flocks of birds. Proc Natl Acad Sci U S A 109: 4786–4791. - PMC - PubMed
    1. Partridge B (1981) Internal dynamics and the interrelations of fish in schools. J Comp Physiol A Neuroethol Sens Neural Behav Physiol 144: 313–325.
    1. Partridge B, Pitcher T, Cullen J, Wilson J (1980) The three-dimensional structure of fish schools. Behav Ecol Sociobiol 6: 277–288.
    1. Hemelrijk C, Hildenbrandt H (2011) Some causes of the variable shape of flocks of birds. PLoS One 6: e22479. - PMC - PubMed

Publication types

LinkOut - more resources