. 2013 Jan;9(1):e1003160.
doi: 10.1371/journal.ppat.1003160. Epub 2013 Jan 31.

Dissection of Ire1 functions reveals stress response mechanisms uniquely evolved in Candida glabrata

Affiliations

Dissection of Ire1 functions reveals stress response mechanisms uniquely evolved in Candida glabrata

Taiga Miyazaki et al. PLoS Pathog. 2013 Jan.

Abstract

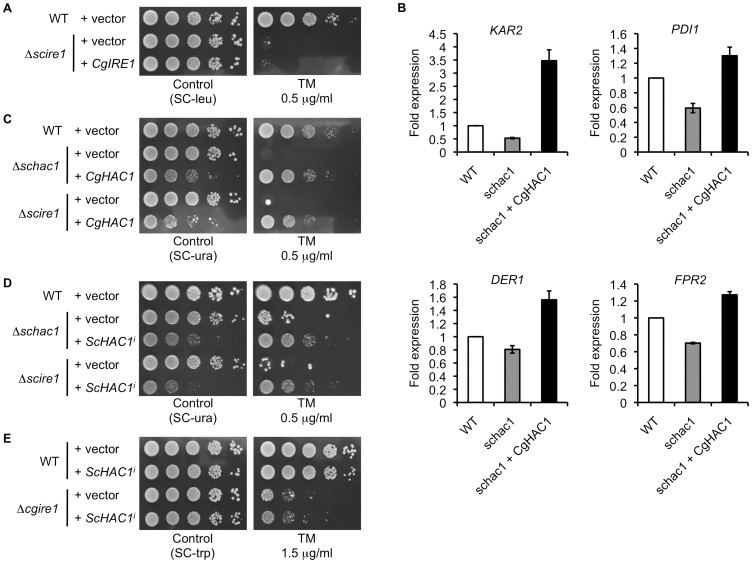
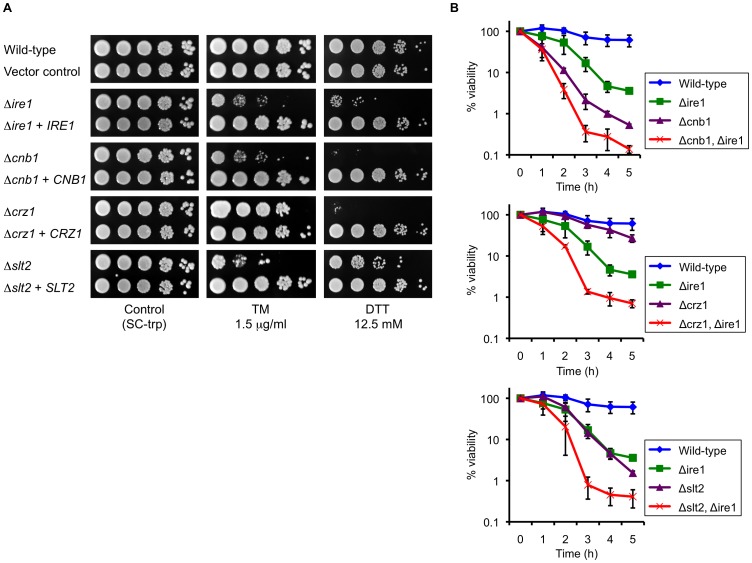
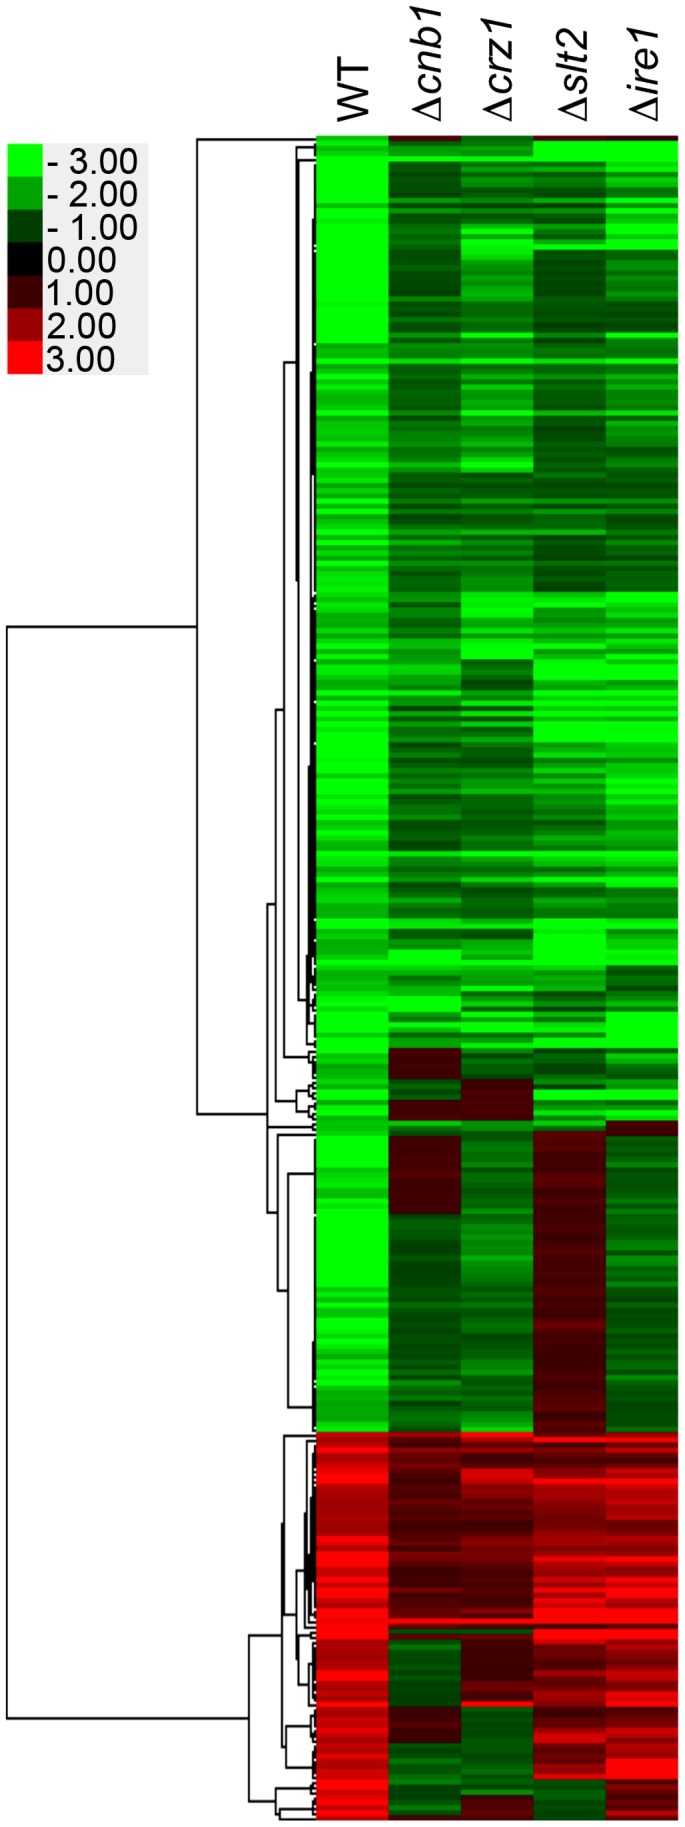
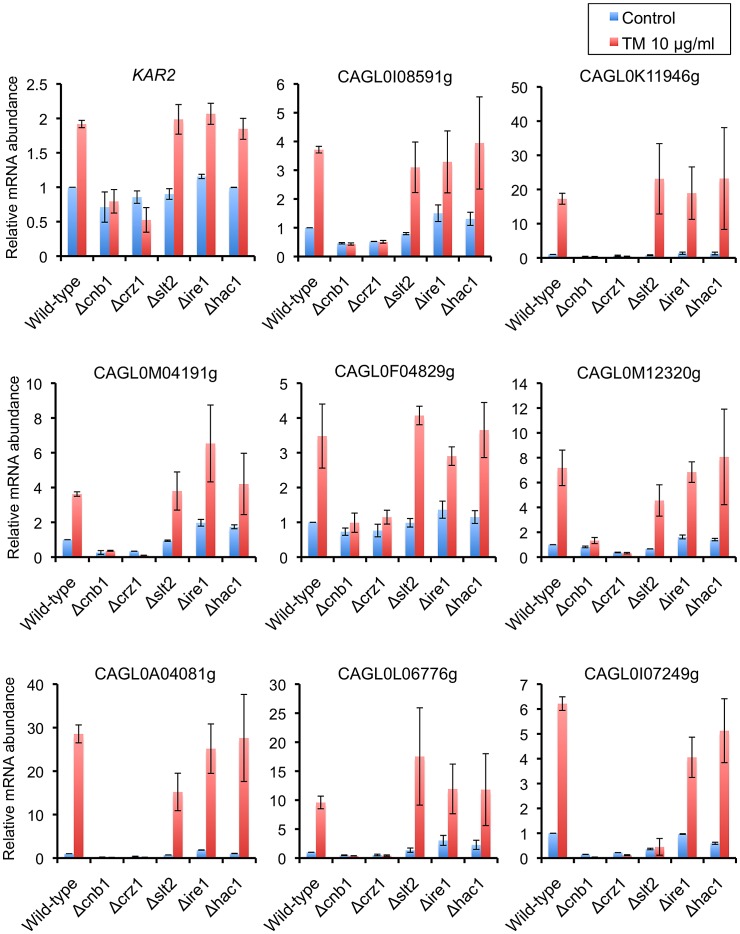
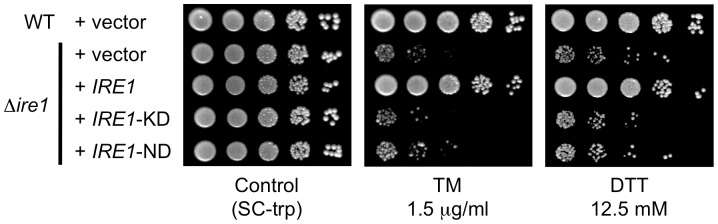
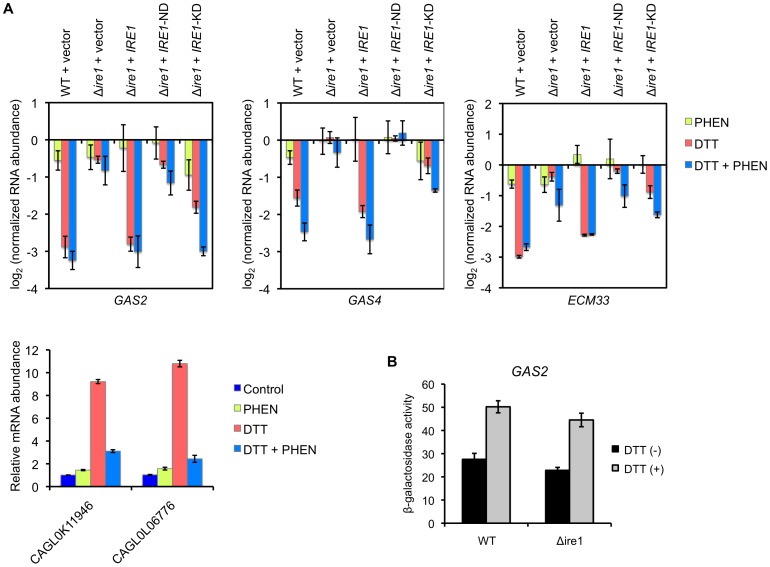
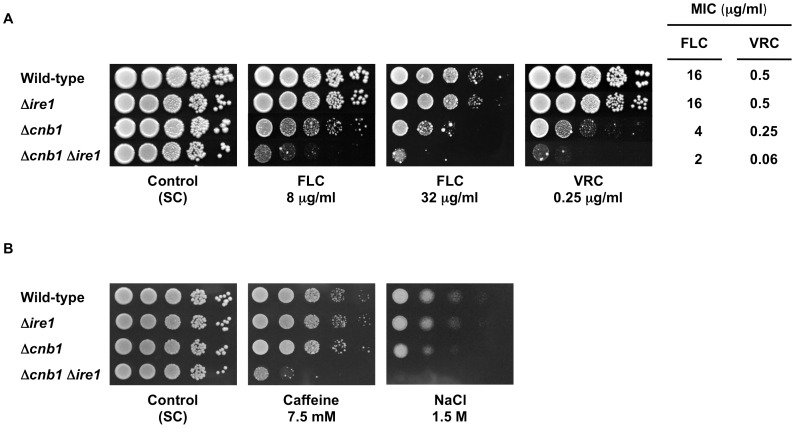
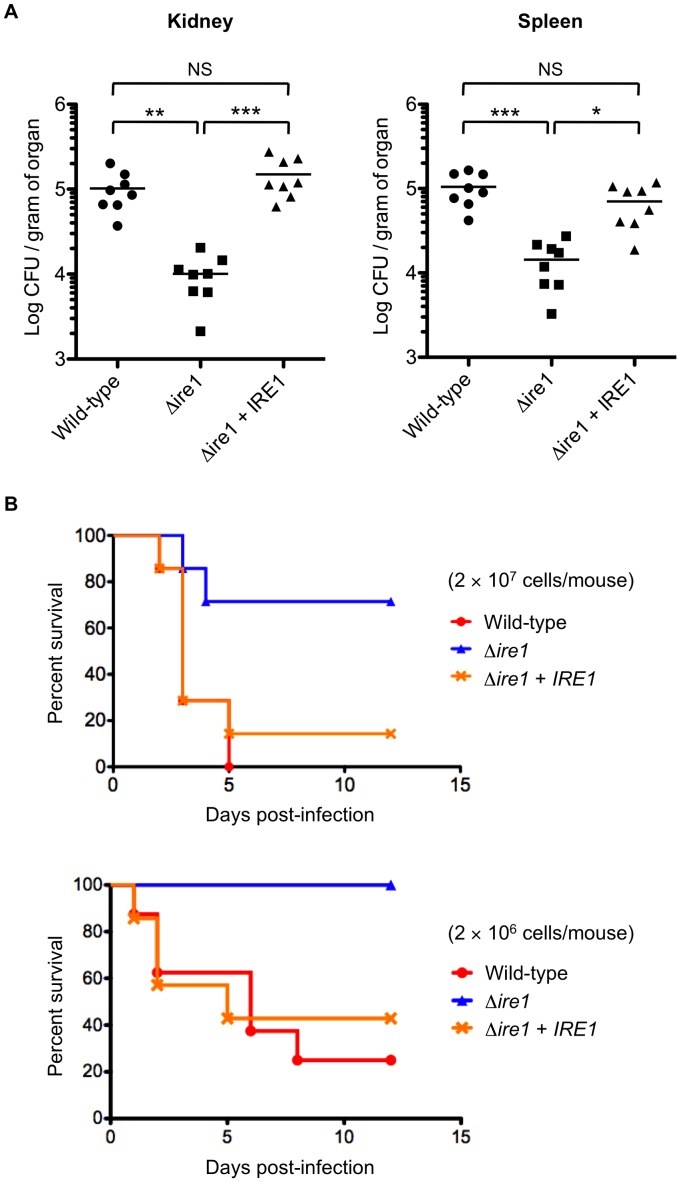
Proper protein folding in the endoplasmic reticulum (ER) is vital in all eukaryotes. When misfolded proteins accumulate in the ER lumen, the transmembrane kinase/endoribonuclease Ire1 initiates splicing of HAC1 mRNA to generate the bZIP transcription factor Hac1, which subsequently activates its target genes to increase the protein-folding capacity of the ER. This cellular machinery, called the unfolded protein response (UPR), is believed to be an evolutionarily conserved mechanism in eukaryotes. In this study, we comprehensively characterized mutant phenotypes of IRE1 and other related genes in the human fungal pathogen Candida glabrata. Unexpectedly, Ire1 was required for the ER stress response independently of Hac1 in this fungus. C. glabrata Ire1 did not cleave mRNAs encoding Hac1 and other bZIP transcription factors identified in the C. glabrata genome. Microarray analysis revealed that the transcriptional response to ER stress is not mediated by Ire1, but instead is dependent largely on calcineurin signaling and partially on the Slt2 MAPK pathway. The loss of Ire1 alone did not confer increased antifungal susceptibility in C. glabrata contrary to UPR-defective mutants in other fungi. Taken together, our results suggest that the canonical Ire1-Hac1 UPR is not conserved in C. glabrata. It is known in metazoans that active Ire1 nonspecifically cleaves and degrades a subset of ER-localized mRNAs to reduce the ER load. Intriguingly, this cellular response could occur in an Ire1 nuclease-dependent fashion in C. glabrata. We also uncovered the attenuated virulence of the C. glabrata Δire1 mutant in a mouse model of disseminated candidiasis. This study has unveiled the unique evolution of ER stress response mechanisms in C. glabrata.


Conflict of interest statement

The authors have declared that no competing interests exist.

Figures

Figure 1
Figure 1. Sequence analysis of C. glabrata Ire1.
(A) Schematic representation of the conserved domain structure of C. glabrata and S. cerevisiae Ire1. Abbreviations: SP, signal peptide; and TM, transmembrane. (B) Sequence alignment of the kinase and nuclease domains of fungal Ire1 orthologs. The asterisk indicates the conserved two catalytic residues in the nucleotide-binding pocket of Ire1 kinase (D797 and K799 in S. cerevisiae and D723 and K725 in C. glabrata). The predicted nuclease domain is underlined. Ten residues (boxed with dotted line) including the highly conserved three-nuclease active sites (arrowheads) are deleted in C. glabrata IRE1-ND. GenBank accession number: Candida glabrata Ire1, XP_446111; Saccharomyces cerevisiae Ire1, NP_011946; Candida albicans Ire1, XP_717532; Cryptococcus neoformans Ire1, XP_568837; and Aspergillus fumigatus IreA, AEQ59230.
Figure 2
Figure 2. Sequence analysis of C. glabrata Hac1.
(A) Sequence alignment of bZIP domains in Hac1 homologs from fungi and humans. The DNA binding domain is underlined. GenBank accession number: Candida glabrata Hac1, XP_448761; Saccharomyces cerevisiae Hac1, NP_116622; Candida albicans Hac1, XP_718538; Aspergillus fumigatus HacA, XP_748727; Cryptococcus neoformans Hxl1, XP_568439; and Homo sapiens Xbp1, NP_005071. (B) A schematic representation of the putative splice sites and ORF lengths in C. glabrata and S. cerevisiae HAC1. The HAC1 ORFs and bZIP domains were shown in grey and blue boxes, respectively. In S. cerevisiae, the intron (purple box) in the uninduced form of HAC1 (HAC1u) is excised in the induced form of HAC1 (HAC1i). Red arrowheads and asterisks indicate putative splice sites and stop codons, respectively. Blue arrows indicate primers that were used for RT-PCR assays to examine HAC1 splicing. (C) Alignment of the RNA sequence surrounding the predicted intron in C. glabrata and S. cerevisiae HAC1. In S. cerevisiae, HAC1 mRNA is known to form stem-loop structures that enclose the intron between the two loops of seven residues (shown in red) held in place by short stems (yellow and green boxes). The predicted 5′ and 3′ splice sites and intron lengths in the S. cerevisiae and C. glabrata HAC1 mRNAs are indicated.
Figure 3
Figure 3. Growth assay in the presence of ER stress-inducing agents.
Logarithmic-phase cells of S. cerevisiae and C. glabrata strains were adjusted to 2×10⁷ cells/ml, and then 5 µl of serial 10-fold dilutions were spotted onto synthetic complete (SC) plates containing either tunicamycin (TM) or dithiothreitol (DTT) at the indicated concentrations. Plates containing TM and DTT were incubated at 30°C for 24 and 48 h, respectively. S. cerevisiae strains: WT, BY4742; Δire1, BY4742Δire1; and Δhac1, BY4742Δhac1. C. glabrata strains: WT, CBS138; Δire1, TG121; and Δhac1, TG141.
Figure 4
Figure 4. Assays for HAC1 mRNA splicing.
(A) RT-PCR analysis. The S. cerevisiae strains containing either empty vector or pRS415-ADH-CgIRE1, in which C. glabrata IRE1 was expressed under the control of the S. cerevisiae ADH1 promoter, were incubated in SC-leu broth in the presence and absence of 1.5 µg/ml tunicamycin (TM) for 3 h. S. cerevisiae strains: WT, BY42-1; Δire1, BY42I-1; and Δire1+CgIRE1, BY42I-2. The C. glabrata wild-type strain CBS138 was incubated in SC broth in the presence and absence of TM and dithiothreitol (DTT) at the indicated concentrations for 1 and 3 h. RT-PCR products of the entire HAC1 mRNA in S. cerevisiae (left panel) and C. glabrata (right panel) were electrophoresed on a 1% agarose gel. (B) Northern blot analysis. S. cerevisiae WT (BY4742) cells were treated with 1.5 µg/ml TM or 5 mM DTT for 1 h (left panel). C. glabrata cells were treated with 10 µg/ml TM or 10 mM DTT for 3 h (right panel). Both ScHAC1 and CgHAC1 probes were generated from the 5′ regions of the HAC1 ORFs. The same blot was probed for HAC1 mRNA, stripped, and then probed for ACT1 mRNA. The asterisks indicate potential splicing intermediates (*: 5′ exon plus the intron; **: 5′ exon alone). C. glabrata strains: WT, CBS138; Δire1, TG121; and Δhac1, TG141.
Figure 5
Figure 5. Functional complementation assays of the IRE1 and HAC1 orthologs in S. cerevisiae and C. glabrata.
(A) C. glabrata IRE1 was expressed under the control of the S. cerevisiae ADH1 promoter in the S. cerevisiae Δire1 mutant. Logarithmic-phase cells were adjusted to 2×10⁷ cells/ml, and then 5 µl of serial 10-fold dilutions were spotted onto agar plates in the presence and absence of 0.5 µg/ml tunicamycin (TM). Plates were incubated at 30°C for 48 h. S. cerevisiae strains: WT+vector, BY42-1; Δscire1+vector, BY42I-1; and Δscire1+CgIRE1, BY42I-2. (B) C. glabrata HAC1 was expressed under the control of the S. cerevisiae ADH1 promoter in the S. cerevisiae Δhac1 mutant. Expression levels of representative UPR target genes in S. cerevisiae were analyzed by qRT-PCR as described in Materials and Methods. Results are presented as fold expression relative to the levels in the wild-type control. The means and standard deviations for three independent experiments are shown. S. cerevisiae strains: WT, BY42-2; schac1, BY42H-1; and schac1+CgHAC1, BY42H-2. (C) C. glabrata HAC1 was expressed under the control of the S. cerevisiae ADH1 promoter in the S. cerevisiae Δhac1 and Δire1 mutants. The assay was performed as in part A. S. cerevisiae strains: WT+vector, BY42-2; Δschac1+vector, BY42H-1; and Δschac1+CgHAC1, BY42H-2; Δscire1+vector, BY42I-3; and Δscire1+CgHAC1, BY42I-4. (D) The induced form of S. cerevisiae HAC1, denoted as ScHAC1i, was expressed under the control of the S. cerevisiae PGK1 promoter in the S. cerevisiae Δhac1 and Δire1 mutants. The assay was performed as in part A. S. cerevisiae strains: WT+vector, BY42-2; Δschac1+vector, BY42H-1; and Δschac1+ScHAC1i, BY42H-3; Δscire1+vector, BY42I-3; and Δscire1+ScHAC1i, BY42I-5. (E) ScHAC1i was expressed under the control of the S. cerevisiae PGK1 promoter in the C. glabrata wild-type and Δire1 mutant strains. The assay was performed as in part A except TM concentration (1.5 µg/ml). C. glabrata strains: WT+vector, TG11; WT+ScHAC1i, TG13; Δcgire1+vector, TG122; and Δcgire1+ScHAC1i, TG126.
Figure 6
Figure 6. Multiple signaling pathways are coordinately involved in the ER stress response in C. glabrata.
(A) The C. glabrata Δire1, Δcnb1, Δcrz1, and Δslt2 deletion mutants were transformed with either an empty vector or a plasmid containing the corresponding wild-type gene. Logarithmic-phase cells were adjusted to 2×10⁷ cells/ml, and then 5 µl of serial 10-fold dilutions were spotted onto synthetic complete medium without tryptophan (SC-trp) plates in the presence and absence of tunicamycin (TM) and dithiothreitol (DTT) at the indicated concentrations. Plates were incubated at 30°C for 48 h. (B) Time-kill analysis of the C. glabrata deletion mutants in the presence of TM. Logarithmic-phase cells (5×10⁵ CFU/ml) were incubated in SC medium containing 1.5 µg/ml TM. The number of viable cells was determined by plating the appropriate dilutions on YPD plates at the indicated time points. Data are expressed as the percentages of viability relative to the untreated (time point 0) control in each strain. The means and standard deviations for three independent experiments are shown. C. glabrata strains: Wild-type, CBS138; Vector control, TG11; Δire1, TG122; Δire1+IRE1, TG123; Δcnb1, TG162; Δcnb1+CNB1, TG163; Δcrz1, TG172; Δcrz1+CRZ1, TG173; Δslt2, TG152; Δslt2+SLT2, TG153; Δcnb1 Δire1, TG1612; Δcrz1 Δire1, TG1712; and Δslt2 Δire1, TG1512.
Figure 7
Figure 7. Genome-wide gene expression profiles in response to tunicamycin (TM) exposure for 3 h.
Hierarchical clustering of genes whose expression levels were changed more than 2-fold after treatment with 1.5 µg/ml TM for 3 h. Genes were clustered with centroid linkage. C. glabrata strains: WT, 2001T; Δcnb1, TG161; Δcrz1, TG171; Δslt2, TG151; and Δire1, TG121.
Figure 8
Figure 8. qRT-PCR validation of transcriptional profiles in the presence of tunicamycin (TM).
Logarithmic-phase C. glabrata cells were incubated in the presence and absence of 10 µg/ml TM. qRT-PCR was performed as described in Materials and Methods. The means and standard deviations for three independent experiments are shown. C. glabrata strains: WT, 2001T; Δcnb1, TG161; Δcrz1, TG171; Δslt2, TG151; Δire1, TG121; and Δhac1, TG141.
Figure 9
Figure 9. Dissection of Ire1 functions required for the ER stress response in C. glabrata.
(A) Both the kinase and nuclease activity of Ire1 are required for cell growth in the presence of ER stress. The C. glabrata Δire1 mutant was transformed with an empty vector or a plasmid containing wild-type IRE1, kinase-dead IRE1 (IRE1-KD), or nuclease-dead IRE1 (IRE1-ND). Logarithmic-phase cells were adjusted to 2×10⁷ cells/ml, and then 5 µl of serial 10-fold dilutions were spotted onto synthetic complete medium without tryptophan (SC-trp) plates in the presence and absence of tunicamycin (TM) and dithiothreitol (DTT) at the indicated concentrations. Plates were incubated at 30°C for 48 h. C. glabrata strains: WT+vector, TG11; Δire1+vector, TG122; Δire1+IRE1, TG123; Δire1+IRE1-ND, TG125; and Δire1+IRE1-KD, TG124.
Figure 10
Figure 10. Analysis of Ire1-dependent mRNA decay in C. glabrata.
(A) Logarithmic-phase C. glabrata cells were incubated in the presence and absence of 10 mM dithiothreitol (DTT) for 2 h. To examine the effects of transcription, cells were treated with the transcription inhibitor 1,10-phenanthroline (PHEN) (50 µg/ml) 5 min before DTT addition. qRT-PCR was performed as described in Materials and Methods. Expression levels of GAS2 (CAGL0M13849g), GAS4 (CAGL0F03883g), and ECM33 (CAGL0M01826g) are expressed as mRNA abundance relative to the untreated control in log2 scale. The means and standard deviations for three independent experiments are shown. (B) β-galactosidase assay. Logarithmic-phase cells of the C. glabrata wild-type and Δire1 strains containing pEM14-GAS2 were exposed to 3 mM DTT for 2 h. β-galactosidase activities of the GAS2 promoter-lacZ fusion gene are expressed in Miller units. The means and standard deviations for three independent experiments are shown.
Figure 11
Figure 11. Effects of IRE1 deletion on stress response in wild-type and Δcnb1 backgrounds in C. glabrata.
(A) Ire1 plays a role in azole tolerance in C. glabrata when calcineurin is absent. Logarithmic-phase cells of each C. glabrata strain were adjusted to 2×10⁷ cells/ml, and then 5 µl of serial 10-fold dilutions were spotted onto synthetic complete (SC) plates containing either fluconazole (FLC) or voriconazole (VRC) at the indicated concentrations. Plates were incubated at 30°C for 48 h. MICs were determined by a broth microdilution method. (B) Ire1 and calcineurin serve redundant roles in cell growth under certain stress conditions in C. glabrata. The assay was performed as in part A. C. glabrata strains: Wild-type, CBS138; Δire1, TG121; Δcnb1, TG161; and Δcnb1 Δire1, TG1612.
Figure 12
Figure 12. C. glabrata Ire1 is required for virulence in a murine model of disseminated candidiasis.
(A) Groups of 8 immunocompetent mice were intravenously inoculated with 8×10⁷ cells for each C. glabrata strain. Bilateral kidneys and spleen were excised 7 days after injection. Appropriate dilutions of organ homogenates were plated, and the numbers of CFU were counted after 2 days of incubation at 30°C. Numbers of recovered CFU from each organ are indicated for individual mice in the scatter plots. The geometric mean is shown as a bar. Statistical analyses were performed using the Kruskal-Wallis test with Dunn's multiple comparison post-test. Asterisks indicate statistically significant differences (*: P<0.05; **: P<0.01; ***: P<0.001). NS indicates no significance (P>0.05). Representative data of two independent experiments are shown. C. glabrata strains: Wild-type, TG11; Δire1, TG122; and Δire1+IRE1, TG123. (B) Groups of 7 mice were immunosuppressed by intraperitoneal administration of cyclophosphamide (200 mg/kg/day) 72, 48, and 24 h before challenge with C. glabrata cells. The mice were infected intravenously with C. glabrata cells (2×10⁷ and 2×10⁶ cells/mouse) on Day 0 of the experiment, and survival was monitored for 12 days post-infection. Kaplan-Meier curves were created and compared with the log rank (Mantel-Cox) test. Upper panel (2×10⁷ cells/mouse): P = 0.0078 for wild-type vs. Δire1, P = 0.0284 for Δire1 vs. Δire1+IRE1, and P = 0.6768 for wild-type vs. Δire1+IRE1; lower panel (2×10⁶ cells/mouse): P = 0.0043 for wild-type vs. Δire1, P = 0.0222 for Δire1 vs. Δire1+IRE1, and P = 0.7440 for wild-type vs. Δire1+IRE1.

Similar articles

Cited by

References

    1. Ellgaard L, Helenius A (2003) Quality control in the endoplasmic reticulum. Nat Rev Mol Cell Biol 4: 181–191. - PubMed
    1. Ron D, Walter P (2007) Signal integration in the endoplasmic reticulum unfolded protein response. Nat Rev Mol Cell Biol 8: 519–529. - PubMed
    1. Vembar SS, Brodsky JL (2008) One step at a time: endoplasmic reticulum-associated degradation. Nat Rev Mol Cell Biol 9: 944–957. - PMC - PubMed
    1. Kaufman RJ (2002) Orchestrating the unfolded protein response in health and disease. J Clin Invest 110: 1389–1398. - PMC - PubMed
    1. Wang S, Kaufman RJ (2012) The impact of the unfolded protein response on human disease. J Cell Biol 197: 857–867. - PMC - PubMed

Publication types

MeSH terms