. 2013;9(1):e1003240.
doi: 10.1371/journal.pgen.1003240. Epub 2013 Jan 31.

Genome-wide haplotype analysis of cis expression quantitative trait loci in monocytes

Collaborators, Affiliations

Genome-wide haplotype analysis of cis expression quantitative trait loci in monocytes

Sophie Garnier et al. PLoS Genet. 2013.

Abstract

In order to assess whether gene expression variability could be influenced by several SNPs acting in cis, either through additive or more complex haplotype effects, a systematic genome-wide search for cis haplotype expression quantitative trait loci (eQTL) was conducted in a sample of 758 individuals, part of the Cardiogenics Transcriptomic Study, for which genome-wide monocyte expression and GWAS data were available. 19,805 RNA probes were assessed for cis haplotypic regulation through investigation of ~2,1 × 10(9) haplotypic combinations. 2,650 probes demonstrated haplotypic p-values >10(4)-fold smaller than the best single SNP p-value. Replication of significant haplotype effects were tested for 412 probes for which SNPs (or proxies) that defined the detected haplotypes were available in the Gutenberg Health Study composed of 1,374 individuals. At the Bonferroni correction level of 1.2 × 10(-4) (~0.05/412), 193 haplotypic signals replicated. 1000 G imputation was then conducted, and 105 haplotypic signals still remained more informative than imputed SNPs. In-depth analysis of these 105 cis eQTL revealed that at 76 loci genetic associations were compatible with additive effects of several SNPs, while for the 29 remaining regions data could be compatible with a more complex haplotypic pattern. As 24 of the 105 cis eQTL have previously been reported to be disease-associated loci, this work highlights the need for conducting haplotype-based and 1000 G imputed cis eQTL analysis before commencing functional studies at disease-associated loci.


Conflict of interest statement

The authors have declared that no competing interests exist.

Figures

Figure 1
Figure 1. Main outlines of the research strategy for identifying cis haplotype effects.
(1): Probes with best haplotype signal (HS) 104-fold smaller than the smallest single-locus signal (SLS) in the discovery study (CTS) were selected for replication in GHS. (2): Probes that had cis htSNPs available in GHS were considered as replicable. (3): Probes for which the global test of cis haplotypic association was significant at the Bonferroni threshold (1.21 10−4) in GHS and the pattern of cis haplotypic association was consistent between CTS and GHS (the same haplotypes with effects in the same direction) were considered as replicated. (4): Cis haplotypic associations were considered as validated when the haplotypic p-value was still significant at the Bonferroni threshold (1.21 10−4) after adjusting for the best (genotyped or imputed) SNP identified in single-locus association analysis in GHS. (5): Nested likelihood ratio tests and conditional haplotype analyses were used to check whether validated haplotype effects could be compatible with the additive effects of multiple SNPs (see Methods). (6): cis Haplotype eQTLs overlapping with disease-associated loci obtained from the Genome-Wide Association Studies catalog (Hindorff et al. 2009) . htSNPs: haplotype tagging SNPs.
Figure 2
Figure 2. Association between ILMN_2367638 (CAMKK2) expression and the main haplotypes derived from rs1140886, rs1063843, and rs11065504.
The left panel shows the results in the discovery cohort CTS and the right panel in the replication cohort GHS. Each bar corresponds to the expected mean of gene expression associated with one dose of the corresponding haplotype under the assumption of additive haplotype effects. According to this model, the expression level of an individual is the sum of the levels of his (her) two haplotypes. Haplotype frequencies are indicated under each haplotype label. For ease of presentation, mean expression for the most frequent haplotype in CTS was set to be the same as that observed in GHS. In CTS, the rs11065504 was substituted by its proxy rs3794207 (r2 = 0.96). After imputation, the best cis eSNP in GHS was rs11065504 whose allele C was carried by an unique haplotype, TCC, which was associated with increased CAMKK2 expression (β = +0.338, p = 9.05 10−156 and β = +0.217, p = 5.69 10−151 in CTS and GHS, respectively) compared to the TCT haplotype. In addition, the less common CCG haplotype was associated with an even stronger increase in CAMKK2 expression (β = +0.386, p = 5.09 10−56 and β = +0.269, p = 4.00 10−53, resp.).
Figure 3
Figure 3. Association between ILMN_1731596 (AP3S2) expression and the main haplotypes derived from rs7173483, rs3803536, and rs1269077.
See the first paragraph of legend in Figure 2 for explanations. In CTS, the rs7173483, rs3803536 and rs1269077 were substituted by their corresponding proxies, rs4932145 (r2 = 1), rs10520684 (r2 = 0.92) and rs1256854 (r2 = 0.95), respectively. After imputation, the best cis eSNP in GHS was rs12148357 which was not among the associated htSNPs. Its minor allele was associated with decreased AP3S2 expression (β = −0.146; p = 1.59 10−54). However, in the conditional model adjusting for haplotype effects, its effect was no longer significant (β = −0.022, p = 0.420) suggesting that it was due to LD with haplotypes. The haplotypic association was compatible with the additive effects of three SNPs. The rs7173483-A allele was associated with decreased AP3S2 expression (β = −0.147, p = 2.80 10−18 and β = −0.1500; p = 9.50 10−11 in CTS and GHS, respectively), as were the rs3803536-G allele (β = −0.052, p = 5.03 10−4 and β = −0.065, p = 1.75 10−6, resp.) and the rs1269077-C allele (β = −0.067, p = 2.93 10−7 and β = −0.066, p = 9.49 10−17, resp.).
Figure 4
Figure 4. Association between ILMN_1726554 (IREB2) expression and the main haplotypes derived from rs1394371, rs13180, and rs950776.
See the first paragraph of legend in Figure 2 for explanations. In CTS, the rs950776 was substituted by its proxy rs1948 (r2 = 0.96). The original haplotypic association (dark grey bars) was compatible with the effects of three common haplotypes associated with increased IREB2 expression, CCT (β = +0.121, p = 1.75 10−12 and β = +0.096, p = 2.40 10−25 in CTS and GHS, respectively), CCC (β = +0.205, p = 2.69 10−29 and β = +0.118, p = 1.10 10−30, resp.) and CTC (β = +0.115, p = 7.87 10−10 and β = +0.059, p = 5.31 10−10, resp.). After adjusting for the best imputed cis eSNP rs12592111 in GHS (light grey), the effect of the CCT and CCC haplotypes were no longer significant (β = −0.026, p = 0.575 and β = +0.011, p = 0.302, respectively) while the effect of the CTC haplotype was barely modified (β = +0.051, p = 2.01 10−7). The CCT and CCC haplotypes are the only two haplotypes carrying the rs13180-C allele, suggesting that these haplotypes were reflecting an effect of rs13180. This is in accordance with the nearly complete association between rs13180 and the best cis eSNP rs12592111 (r2 = 0.96).
Figure 5
Figure 5. Association between ILMN_1689088 (COLEC12) expression and the main haplotypes derived from rs9966524, rs9960856, and rs2846666.
See the first paragraph of legend in Figure 2 for explanations. In CTS, the rs9966524 and rs2846666 were substituted by their corresponding proxies, rs3932728 (r2 = 0.82) and rs2846667 (r2 = 0.87). The original haplotypic association (dark grey bars) was due to two haplotypes associated with increased COLEC12 expression, the TCA (β = +0.331 p = 3.07 10−10 and β = +0.111, p = 5.83 10−4, in CTS and GHS, respectively) and the CCA (β = +0.278 p = 5.96 10−18 and β = +0.204, p = 4.19 10−60, in CTS and GHS, resp.). In GHS, the best imputed cis eSNP was rs11081136 whose minor allele was associated with increased COLEC12 expression (β = +0.091, p = 1.02 10−26). After adjustment for rs11081136 (light grey bars), the TCA (β = +0.092, p = 2.52 10−3) and CCA (β = +0.171, p = 1.39 10−40) haplotypes were still associated with COLEC12 expression. The rs11081136 effect also remained significant (β = +0.061, p = 1.12 10−13).
Figure 6
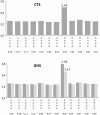
Figure 6. Association between ILMN_1757379 (OPN1SW) expression and the haplotypes derived from rs1109552, rs4731507, rs4731513, and rs339088.
The top panel shows the results in the discovery cohort CTS and the bottom panel in the replication cohort GHS. Each bar corresponds to the expected mean of gene expression associated with one dose of the corresponding haplotype under the assumption of additive haplotype effects. According to this model, the expression level of an individual is the sum of the levels of his (her) two haplotypes. Haplotype frequencies are indicated under each haplotype label. In CTS, the rs4731507 and rs339088 were substituted by their perfect proxies (r2 = 1) rs4283986 and rs339085, respectively. The original haplotypic association (dark grey bars) was due to a unique rare haplotype derived from 4 common htSNPs. This rare haplotype, GGGG, was associated with a strong increase in OPN1SW expression (β = +0.240, p = 8.12 10−26 and β = +0.341, p<10−307 in CTS and GHS, respectively). After adjusting in GHS for the best imputed cis eSNP rs142976957 (light grey bars), the effect of this rare haplotype was still highly significant (β = +0.208, p = 4.78 10−135).

References

    1. Cookson W, Liang L, Abecasis G, Moffatt M, Lathrop M (2009) Mapping complex disease traits with global gene expression. Nat Rev Genet 10: 184–194. - PMC - PubMed
    1. Li J, Burmeister M (2005) Genetical genomics: combining genetics with gene expression analysis. Hum Mol Genet 14 Spec No. 2: R163–169. - PubMed
    1. Montgomery SB, Dermitzakis ET (2009) The resolution of the genetics of gene expression. Hum Mol Genet 18: R211–215. - PubMed
    1. Goring HH, Curran JE, Johnson MP, Dyer TD, Charlesworth J, et al. (2007) Discovery of expression QTLs using large-scale transcriptional profiling in human lymphocytes. Nat Genet 39: 1208–1216. - PubMed
    1. Dixon AL, Liang L, Moffatt MF, Chen W, Heath S, et al. (2007) A genome-wide association study of global gene expression. Nat Genet 39: 1202–1207. - PubMed

Publication types

MeSH terms