. 2013;9(1):e1003245.
doi: 10.1371/journal.pgen.1003245. Epub 2013 Jan 31.

The role of autophagy in genome stability through suppression of abnormal mitosis under starvation

Affiliations

The role of autophagy in genome stability through suppression of abnormal mitosis under starvation

Aiko Matsui et al. PLoS Genet. 2013.

Abstract

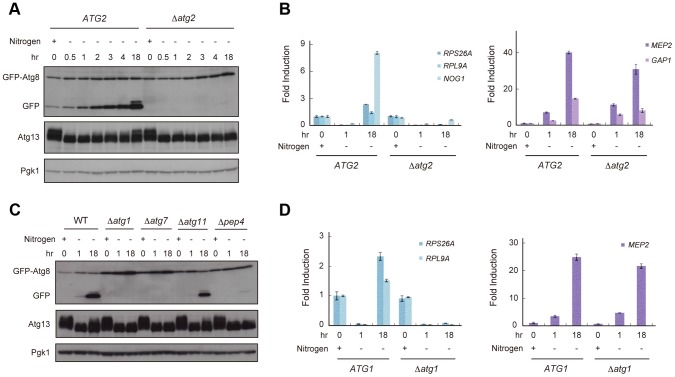
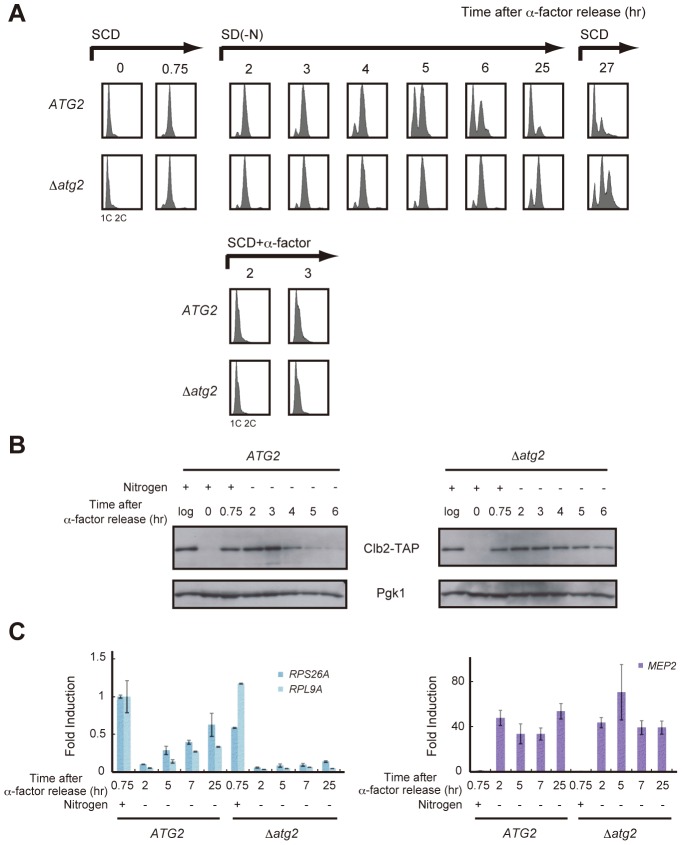
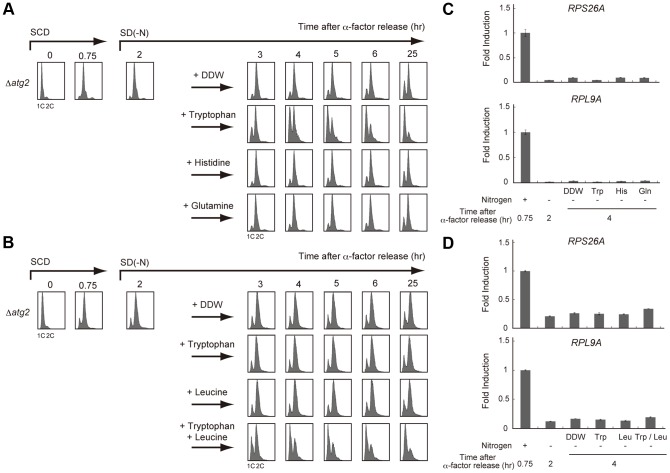
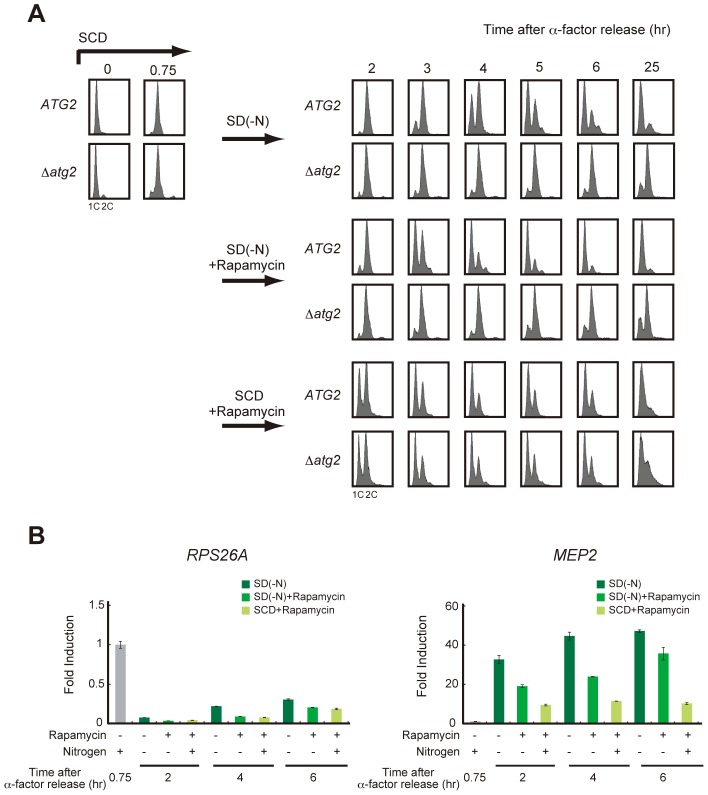
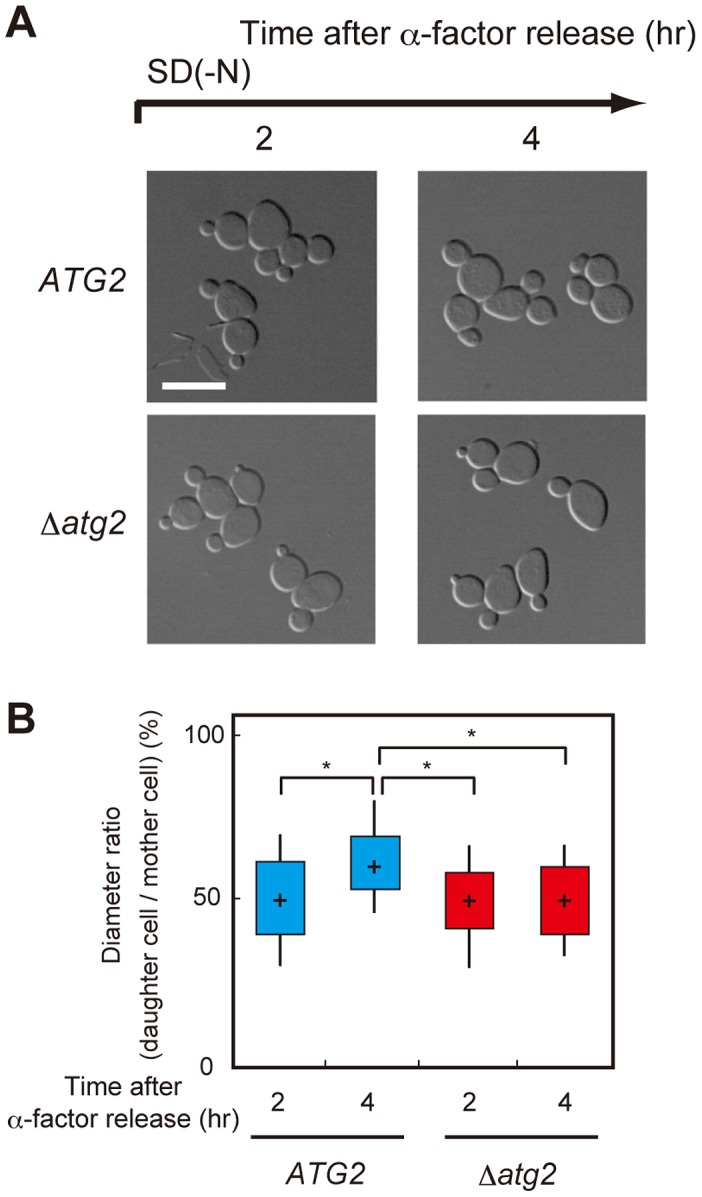
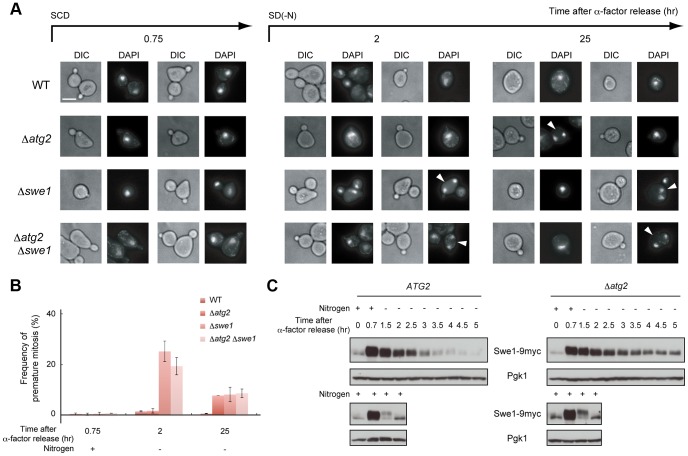
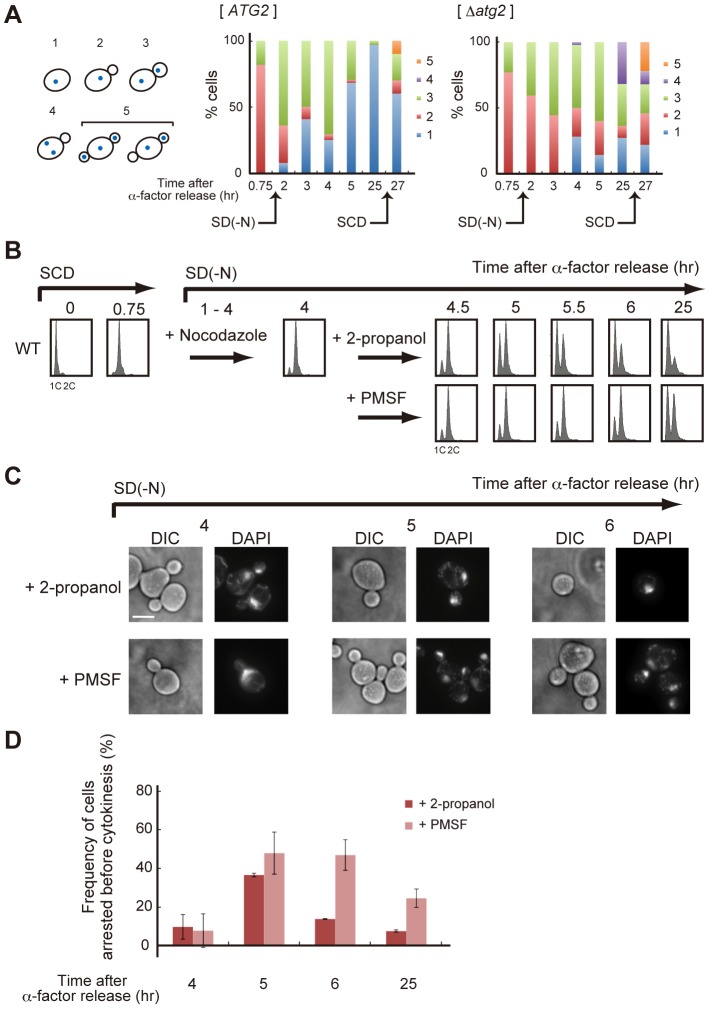
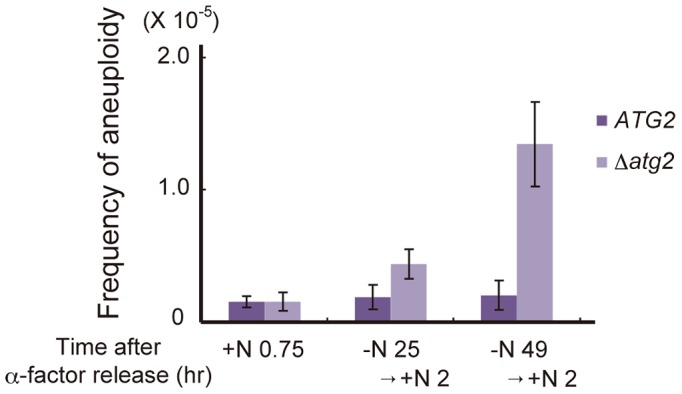
The coordination of subcellular processes during adaptation to environmental change is a key feature of biological systems. Starvation of essential nutrients slows cell cycling and ultimately causes G1 arrest, and nitrogen starvation delays G2/M progression. Here, we show that budding yeast cells can be efficiently returned to the G1 phase under starvation conditions in an autophagy-dependent manner. Starvation attenuates TORC1 activity, causing a G2/M delay in a Swe1-dependent checkpoint mechanism, and starvation-induced autophagy assists in the recovery from a G2/M delay by supplying amino acids required for cell growth. Persistent delay of the cell cycle by a deficiency in autophagy causes aberrant nuclear division without sufficient cell growth, leading to an increased frequency in aneuploidy after refeeding the nitrogen source. Our data establish the role of autophagy in genome stability through modulation of cell division under conditions that repress cell growth.


Conflict of interest statement

The authors have declared that no competing interests exist.

Figures

Figure 1
Figure 1. Reduced TORC1 activity by nitrogen starvation is partially recovered in an autophagy-dependent manner.
(A) ATG2 (AMY182-10C) and Δatg2 (AMY182-10A) cells grown in SCD-Ura-Trp medium at 30°C were transferred to SD-N medium for the indicated times. Cell lysates were prepared using the alkaline-trichloroacetic acid method and analyzed by immunoblot with anti-GFP, anti-Atg13 and anti-Pgk1 antibodies. Progression of autophagy was monitored by accumulation of the free GFP moiety from the GFP-Atg8 fusion protein . Pgk1 was used as a loading control. Uncropped images of blots are shown in Figure S5. Samples taken at 4-h intervals for 20 h demonstrated that the re-phosphorylation of Atg13 increased monotonically (data not shown). (B) ATG2 (AMY182-10C) and Δatg2 (AMY182-10A) cells grown in SCD-Ura-Trp medium at 30°C were transferred to SD-N medium for the indicated times. Total RNA was extracted and analyzed for the expression of RPS26A, RPL9A and NOG1 (left panel), and MEP2 and GAP1 (right panel) by RT-qPCR. Each sample was calibrated by TUB1 (Figure S1). (C) WT (AMY182-10C), Δatg1 (AMY236), Δatg7 (AMY237), Δatg11 (AMY238), and Δpep4 (AMY239) cells grown in SCD-Ura-Trp medium at 30°C were transferred to SD-N medium for the indicated times. Cell lysates were prepared and analyzed by immunoblot as described in (A). Uncropped images of blots are shown in Figure S5. (D) ATG1 (SAY122) and Δatg1 (AMY240) cells grown in SCD-Ura-Trp medium at 30°C were transferred as described in (C). Total RNA was extracted and analyzed for the expression of RPS26A and RPL9A (left panel) and MEP2 (right panel) by RT-qPCR. Each sample was calibrated by TUB1.
Figure 2
Figure 2. Autophagy is required for cell cycle progression during starvation.
(A) ATG2 (SAY122) and Δatg2 (AMY250) cells were arrested at G1 by α-factor and released into SCD medium. Synchronous cultures were collected after 0.75 h and re-released into SD-N medium or SCD medium. To monitor cell cycle progression to G1 under the nutrient-rich condition, SCD medium was supplemented with 6.7 ng/mL α-factor for re-arrest at G1. After 25 h, the cell culture was re-released into SCD medium. DNA content at each time point was measured by FACS analysis. (B) ATG2 (AMY251) and Δatg2 (AMY253) cells were arrested at G1 by α-factor and released into SCD medium. Synchronous cultures were collected after 0.75 h and re-released into SD-N medium. Cell lysates were prepared as described in Figure 1A, and analyzed by immunoblot with anti-PAP and anti-Pgk1 antibodies. Pgk1 was used as a loading control. Uncropped images of blots are shown in Figure S5. (C) ATG2 (SAY122) and Δatg2 (AMY250) cells were grown as described in (A). Total RNA was extracted and analyzed for the expression of RPS26A and RPL9A (left panel) and MEP2 (right panel) by RT-qPCR. Each sample was calibrated by TUB1.
Figure 3
Figure 3. Supply of specific amino acids is sufficient for cell cycle re-progression after G2/M delay.
(A) Δatg2 (AMY250) cells were arrested at G1 by α-factor and released into SCD medium. Synchronous cultures were collected after 0.75 h and re-released into SD-N medium. After 2 h from α-factor release, each culture was supplemented with tryptophan, histidine, or glutamine at a final concentration of 25 µg/mL, 10 µg/mL and 25 µg/mL, respectively. Double distilled water (DDW) was used as a control. DNA content at each time point was measured by FACS analysis. (B) Δatg2 (AMY296) cells were arrested at G1 by α-factor and released into SCD medium. Synchronous cultures were collected after 0.75 h and re-released into SD-N medium. After 2 h from α-factor release, each culture was supplemented with tryptophan, leucine, or both tryptophan and leucine. DDW was used as a control. DNA content at each time point was measured by FACS analysis. Tryptophan and leucine were used at a final concentration of 25 µg/mL and 10 µg/mL, respectively. (C) Δatg2 (AMY250) cells were grown as described in (A). Total RNA was extracted and analyzed for the expression of RPS26A (upper panel) and RPL9A (lower panel) by RT-qPCR. Each sample was calibrated by TUB1. (D) Δatg2 (AMY296) cells were grown as described in (B). Total RNA was extracted and analyzed for the expression of RPS26A (upper panel) and RPL9A (lower panel) by RT-qPCR. Each sample was calibrated by TUB1.
Figure 4
Figure 4. Recovery of TORC1 activity may be dispensable for cell cycle progression under starvation conditions.
(A) ATG2 (SAY122) and Δatg2 (AMY250) cells were arrested at G1 by α-factor and released into SCD medium. Synchronous cultures were collected after 0.75 h and re-released into SD-N medium, SD-N medium containing rapamycin, or SCD medium containing rapamycin. DNA content was measured by FACS analysis. Rapamycin was used at a final concentration of 200 ng/mL. (B) ATG2 (SAY122) cells were grown as described in (A). Total RNA was extracted and analyzed for the expression of RPS26A (left panel) and MEP2 (right panel) by RT-qPCR. Each sample was calibrated by TUB1.
Figure 5
Figure 5. Autophagy is important for cell growth under nutrient starvation conditions.
(A) ATG2 (SAY122), Δatg2 (AMY255) cells were arrested at G1 by α-factor and released into SCD medium. Synchronous cultures were collected after 0.75 h and re-released into SD-N medium. The fixed cells were observed by differential interference contrast microscopy. Bar, 10 µm. (B) ATG2 (SAY122) and Δatg2 (AMY255) cells were grown as described in (A). The ratio of the diameter of a bud or daughter cell to that of the mother was calculated 2 h and 4 h after α-factor release. The box plots represent the distribution of the ratios. The plot shows the medians (central cross figure) with the 25th and 75th percentiles (box). The lower line protruding from the box ends at the 10th percentiles, whereas the upper line ends at the 90th percentile. Single asterisks designate significant differences (P<0.01); unstarred comparisons are not significantly different (P>0.05).
Figure 6
Figure 6. Autophagy is important for normal cell division under nutrient starvation conditions.
(A) WT (SAY122), Δatg2 (AMY255), Δswe1 (AMY260), and Δatg2 Δswe1 (AMY261) cells were arrested at G1 by α-factor and released into SCD medium. Synchronous cultures were collected after 0.75 h and re-released into SD-N medium. The fixed cells were stained with DAPI and observed by differential interference contrast microscopy (DIC) or by fluorescence microscopy (DAPI). The arrowheads indicate cells undergoing premature mitosis (type 4 in Figure 7A). Bar, 5 µm. (B) WT (SAY122), Δatg2 (AMY255), Δswe1 (AMY260), and Δatg2 Δswe1 (AMY261) cells were grown as described in (A). The frequency of premature mitosis (type 4 in Figure 7A) was calculated. (C) ATG2 (YYK536) and Δatg2 (AMY330) cells were arrested at G1 by α-factor and released into SCD medium. Synchronous cultures were collected after 0.7 h and re-released into SD-N medium or SCD medium. To monitor cell cycle progression to G1 under the nutrient-rich condition, SCD medium was supplemented with 6.7 ng/mL α-factor for re-arrest at G1. Cell lysates were prepared as described in Figure 1A, and analyzed by immunoblot with anti-myc and anti-Pgk1 antibodies. Pgk1 was used as a loading control. Uncropped images of blots are shown in Figure S5.
Figure 7
Figure 7. Autophagy is required for completion of cytokinesis.
(A) ATG2 (SAY122) and Δatg2 (AMY250) cells were arrested at G1 with α-factor and released into SCD medium. Synchronous cultures were collected after 0.75 h and re-released into SD-N medium. After 25 h, cell cultures were re-released into SCD medium. Cells were observed by differential interference contrast microscopy, and Hoechst 33342-stained nuclei and the tubulin-GFP of each cell were observed by fluorescence microscopy. The rates of cells with the following morphologies were calculated: 1) unbudded cells with a nucleus, 2) small-budded cells with a nucleus, 3) large-budded cells with one nucleus each in the mother and the daughter, 4) small-budded cells with two nuclei in the mother, and 5) cells harboring two small buds, with one nucleus each in the mother cells and at least one daughter cell. (B) WT (SAY122) cells were arrested at G1 by α-factor and released into SCD medium. Synchronous cultures were collected after 0.75 h and re-released into SD-N medium containing 5 µg/mL nocodazole. After 3 h, synchronous cultures arrested at metaphase by nocodazole were collected and re-released into SD-N medium containing 1 mM PMSF. 2-propanol was used as a control. DNA content at each time point was measured by FACS analysis. (C) WT (SAY122) cells were grown as described in (B). The fixed cells were stained with DAPI and observed by differential interference contrast microscopy (DIC) or by fluorescence microscopy (DAPI). Bar, 5 µm. (D) WT (SAY122) cells were grown as described in (B). The frequency of cells arrested before cytokinesis (type 3 in A) was calculated.
Figure 8
Figure 8. Autophagy deficiency results in an increased frequency of aneuploidy after the addition of a nitrogen source.
ATG2 (DBY4962) and Δatg2 (AMY262) cells arrested at G1 by α-factor were released into SC-Ura medium. Synchronous cultures were collected after 0.75 h and re-released into SD-N medium. After 25 h and 49 h, cell cultures were re-released into SCD medium. Appropriately diluted 0.75, 25+2 and 49+2 h aliquots were plated onto YEPD plates and selective medium lacking both leucine and uracil. Colonies were scored after 4 days at 30°C.

References

    1. Tsukada M, Ohsumi Y (1993) Isolation and characterization of autophagy-defective mutants of Saccharomyces cerevisiae . FEBS Lett 333: 169–174. - PubMed
    1. Thumm M, Egner R, Koch B, Schlumpberger M, Straub M, et al. (1994) Isolation of autophagocytosis mutants of Saccharomyces cerevisiae . FEBS Lett 349: 275–280. - PubMed
    1. Nakatogawa H, Suzuki K, Kamada Y, Ohsumi Y (2009) Dynamics and diversity in autophagy mechanisms: lessons from yeast. Nat Rev Mol Cell Biol 10: 458–467. - PubMed
    1. Mizushima N (2007) Autophagy: process and function. Genes Dev 21: 2861–2873. - PubMed
    1. Oku M, Sakai Y (2008) Pexophagy in Pichia pastoris. Methods Enzymol 451: 217–228. - PubMed

Publication types

MeSH terms